 ISSN: 1935-1232 (P)


Research Article - Clinical Schizophrenia & Related Psychoses ( 2023) Volume 17, Issue 4
AI-Enabled Study of Funding Cuts in the UK: Exploring Regional Mental Health Disparities through Machine Learning
Md Abu Sufian1, Jayasree Varadarajan2, Md Sipon Miah3,4,5 and Mingbo Niu3*2Center for Digital Innovation, Manchester Metropolitan University, Manchester, United Kingdom
3IVR Low-Carbon Research Institute, Chang’an University, Shaanxi, China
4Department of Information and Communication Technology, Islamic University, Kushtia, Bangladesh
5Department of Signal Theory and Communications, Charles III University of Madrid, Madrid, Spain
Mingbo Niu, IVR Low-Carbon Research Institute, Chang’an University, Shaanxi, China, Email: ivr.niu@chd.edu.cn
Received: 30-Oct-2023, Manuscript No. CSRP-23-118811; Editor assigned: 01-Nov-2023, Pre QC No. CSRP-23-118811 (PQ); Reviewed: 16-Nov-2023, QC No. CSRP-23-118811; Revised: 23-Nov-2023, Manuscript No. CSRP-23-118811 (R); Published: 30-Nov-2023, DOI: 10.3371/CSRP.SMJV.112323
Abstract
Background: The UK’s mental health services are grappling with significant challenges due to extensive funding cuts, resulting in elongated waiting times, a dearth of professionals and heightened stigma surrounding mental health.
Objective: This research sets out to decipher the ramifications of these funding cuts on regional disparities in mental health services in the UK by harnessing Artificial Intelligence (AI) and Machine Learning (ML) methodologies, specifically Support Vector Machines (SVM) and ridge regression.
Methods: In our approach, we constructed Support Vector Regression (SVR) and ridge regression models to predict patient outcomes, which stand as indicators of service quality. Alongside, sentiment analysis was employed on patient feedback to elucidate evolving perceptions of mental health services over temporal and regional spectra.
Findings: Our analysis unveiled that while the SVR model demonstrated accuracy constraints, the ridge regression model adeptly elucidated approximately 57.6% of the variance in patient outcomes. The sentiment assessment pinpointed the South region amassing the peak sentiment score of (84.36%), an emblem of overwhelmingly positive sentiments regarding mental health services. A nuanced positive correlation materialized between funding levels and sentiment-driven patient outcomes. Moreover, a pronounced nexus surfaced between funding and staffing levels, with profound implications for patient outcomes.
Significance: These revelations accentuate glaring regional disparities, ushering in a clarion call for harmonized resource distribution and tenable funding stratagems in the mental health domain. By weaving in sentiment analysis with AI and ML paradigms, we dive deeper into the quagmire of patient sentiments, amplifying our prognostic prowess concerning funding trajectories and service quality.
Conclusion: At the heart of this inquiry lies an emphatic appeal for sustainable funding blueprints and the untapped potential of AI and ML to unravel the intricate interplay between funding truncations, staffing paradigms and sentiment-informed patient outcomes within the UK’s mental health tapestry.
Keywords
Artificial intelligence • Machine learning • Regression analysis • Regional disparities • Ridge regression
Introduction
The rate of mental health issues and psychological diseases has dramatically increased as a result of contemporary social developments. The World Health Organization (WHO) defines ”mental health” as the state of being able to manage life’s stresses to the best of one’s ability while still being able to function regularly and successfully at work and contribute to society [1]. A person’s way of life, including stress at work, poor financial circumstances, problems with family and relationships, violence, relationship problems and environmental variables, are likely the root cause of elements that impact mental health [2]. These circumstances can lead to mental health conditions like depression, anxiety, stress and other psychological conditions that impact a person’s overall well-being and quality of life. Data indicate that one in four people may have mental health issues at some point in their lives, making them a substantial public health risk in the United Kingdom. The critical relevance of strong mental health services within the larger healthcare system is shown by this high frequency. However, the National Health Service (NHS) has experienced considerable financial cuts in recent years, which have led to dramatic changes in mental health care. Previous research has indicated a detrimental effect of these funding cuts on the quality and accessibility of mental health services [3]. Despite this, there are still few thorough, quantitative analyses of the numerous effects of these funding reductions. Few studies have attempted to integrate these findings into a more comprehensive picture of the systemic changes occurring within the UK’s mental health sector. Many studies that have been done to far have concentrated on specific factors like service accessibility or patient satisfaction. This study departs from earlier work by taking a rigorous quantitative approach and investigating the effects of funding reductions on staffing levels, the availability of services, patient outcomes, and regional inequities. By doing this, this study hopes to close the knowledge gap in the existing literature and offer a more in-depth and thorough understanding of how funding cuts have affected mental health services in the UK. Despite the difficulties caused by financial cuts, the UK government has made attempts to ameliorate these problems. Most significantly, new funding has been allocated, which is anticipated to boost the availability of mental health services by 10% over the next two years. The necessity for research like this one, which aims to map the changing landscape of mental health care and offer insightful information to guide future policy and financing decisions, is further highlighted by these on-going changes. In light of the foregoing, this study is not only essential in light of previous research but also helpful in addressing the changing demands of the UK’s mental health sector.
Rational
The United Kingdom’s mental health services are confronted with a significant obstacle in the form of persistent budgetary limitations and concomitant increases in service utilization. NHS providers reports that between 2011 and 2018, mental health trusts in England saw an 8% reduction in funding, despite a 20% rise in demand during that time. This study’s topic was determined by the statistics, which highlight the urgent need for further investigation into this matter [4]. Our aim to utilize machine learning and artificial intelligence methodologies, specifically SVR and ridge regression, to investigate the impact of funding cuts on regional disparities in mental health services in the UK and predict future trends.
Research questions
1. How can SVR and ridge regression enhance our understanding of the correlation between funding cuts and factors such as patient outcomes, staffing levels, discharges, emergency referrals, and patient satisfaction?
2. What regional disparities in mental health services can be identified using SVR and ridge regression and how do these disparities affect the quality of mental health care in the UK?
3. How can machine learning be utilized to predict future trends in NHS funding and the potential impacts on regional disparities in mental health services?
4. What are the policy implications of the study findings and how can these insights guide the development of sustainable funding solutions and regional interventions in mental health services?
Materials and Methods
Related work
Mental health disparities in the United Kingdom and beyond are an on-going public health challenge. The advent of social media platforms and the extensive use of Online Social Networks (OSNs) have opened up new avenues for researchers to explore mental health-related issues. This literature review examines the key studies that employ machine learning and data analysis techniques to examine various facets of mental health, encompassing stress, mental disorders, suicide, depression, distress and general mental illness. These investigations draw from diverse datasets and methodologies, collectively shedding light on the extent of these disparities and contributing to the development of AI- enabled tools for mental health assessment [5-8].
Kandias et al. addressed the issue of chronic stress by gathering data from Facebook users who provided informed consent. Their study, based on a substantial dataset, aimed to discern the level of chronic stress experienced by individuals by analyzing the content they shared on OSNs. This innovative approach offered valuable insights into stress assessment through the analysis of social media content [9]. Lin et al. focused on stress detection, employing a hybrid algorithm that incorporated Twitter social interaction and user-generated content. By combining deep learning and machine learning algorithms, this study presented an innovative approach for the accurate detection of stress based on user interactions and content on Twitter [10].
Shuai et al. introduced a framework for the precise identification of potential instances of mental disorders through social networks. Their novel technique, SNMDD, aimed to categorize potential mental disorders by analyzing user behavior and content on social networks, contributing to the early identification of mental health issues using social media data [11].
Thelwall tackled stress detection by categorizing data from 3,000 tweets about stress. The study introduced TensiStrength, an innovative approach that combined deep learning and machine learning methods to detect stress and relaxation based on the analysis of social media content. TensiStrength proved to be a valuable tool for understanding the stress levels of individuals on OSNs [12].
O’Dea et al. shifted their focus to suicide-related content on social media, employing machine learning and human coding methods to analyze data. By doing so, they contributed to a more comprehensive understanding of suicide-related content and its prevalence on social media platforms [13].
Tsugawa et al. explored stress identification and depression prediction using OSNs as a tool. Their technique, supported by Support Vector Machines (SVM), aimed to predict the likelihood of sadness based on various variables derived from users’ Twitter activity. This approach facilitated the automated identification of emotional states on social media [14].
Deshpande and Rao concentrated on depression, utilizing Natural Language Processing (NLP) to analyze twitter streams for depression-related emotions. Employing Support Vector Machines (SVM) and Naive Bayes (NB) classifiers for class prediction, the study contributed to more accurate assessments of depression through social media content [15].
In another perspective, Saleem et al. developed a multistage text categorization framework for evaluating psychological status in online forums. By employing Machine Learning Networks (MLN) for noisy distress label detection and Support Vector Machines (SVM) for distress detection, this study introduced an innovative method for identifying psychological distress across a wide range of mental health conditions [16].
Saravia et al. explored the use of community portals and large datasets to create prediction models based on users’ language and behavioural patterns. Employing a Random Forest (RF) classifier, this innovative method paved the way for predictive analysis in the context of mental illness based on user-generated content and interactions in online communities [17]. These studies collectively under- score the evolving role of machine learning and AI in advancing our understanding of mental health disparities and in the development of tools for early detection and intervention as shown in Table 1.
| Authors | Mental health types | Data set | Objectives | Method of data analysis |
|---|---|---|---|---|
| Kandias et al. 2017 [9] | Stress | Facebook users who provided informed consent (405 fully crawled, 12,346 groups, 98,256 liked objects, 171,054 statuses, and 250,027 comments) | To investigate the level of chronic stress that people experience based on the content that OSNs users upload | This study looks into the amount of chronic stress that people experience based on the content that OSNs users publish |
| Lin et al. 2017 [10] | Stress | Four data sets: The first has 19,000 tweets (with stress) and 17,000 non-stressful tweets | To develop a hybrid algorithm that uses Twitter social interaction and user content to detect stress | A hybrid technique for data analysis that contrasts various deep learning and machine learning algorithms |
| Shuai et al. 2017 [11] | Mental disorders | 3,126 OSNs users (1,790 males and 1,336 females) | To offer a framework for precisely identifying possible instances of mental illnesses related to social networks | A novel technique dubbed SN- MDD |
| Thelwall et al. 2017 [12] | Stress | Information gathered from 3,000 tweets about stress was categorized using a scale of 1 to 5 | To produce a mechanism for detecting stress and re-laxation that was uploaded on OSNs | Tensi Strength is a novel approach that contrasts deep learning and machine learning methods |
| O’Dea et al. 2015 [13] | Suicide | 1,820 tweets in total, divided into Set A (746 for training, 83 for testing) and Set B (891 for training, 100 for testing) | To look at the rate of suicide | Data compared using machine learning and human coding methods |
| Tsugawa et al. 2015 [14] | Stress | 219 participants aged 16 to 55 (121 men and 88 women) | To suggest using OSNs as a tool for stress identification and to present a technique that uses users’ social media activity to identify depression | Models employ SVM to predict the likelihood of sad- ness based on many variables gleaned from users’ Twitter activity |
| Deshpande and Rao 2017 [15] | Depression | 10,000 tweets were gathered to create 80:20 training and test datasets. The training set includes terms like ”depressed,” ”hopeless,” and ”suicide” that allude to depressive tendencies | NLP was used in this study to analyze Twitter streams for depression- related emotions. For the purpose of class prediction, SVM and NB classifiers were employed. | For the purpose of class prediction, SVM and NB classifiers were employed |
| Saleem et al. 2012 [16] | Distress | Collaborated with psychologists to create 136 classifications for psychological dis- tress from PTSD to mild traumatic brain injury and depressive symptoms | To offer a novel method for evaluating psychological status in online forums using a multistage text categorization frame- work. For noisy distress label detection, MLN was employed, and SVM was used for distress detection. | For noisy distress label detection, MLN was employed, and SVM was used for distress detection. For noisy distress label detection, MLN was employed, and SVM was used for distress detection |
| Saravia et al. 2016 [17] | Mental illness | Information gathered from community portals is composed of 12 BD and 17 BPD. There are 5,000 followers per portal out of 145,000 accounts. Following filtering, there were 278 BD and 203 BPD | To suggest an innovative method of gathering data to create prediction models based on users’ language and behavioral patterns | Data evaluated with an RF classifier |
Proposed research methodology
Our research methodology consists of the data source, data collection, pre-processing, the feature extraction method, and regression performance in machine learning techniques that can help conduct the study coherently and logically; this will guarantee that we will successfully address the research problem.
Data source: The UK national government’s NHS website has been collected the data for this quantitative research method and the secondary data sets that have been gathered cover a century, from 1923 to 2022. Since secondary data sets can be obtained more quickly and affordably. Additionally, by using this data, the research data set has been statistically tested to make validation and the research questions can be addressed.
Gauging distributional uniformity: In the quest to understand the correlation between funding cuts and various metrics like patient outcomes, staffing levels and patient satisfaction, it’s imperative to first ascertain the nature of our dataset’s distribution. Through the dual use of histograms and Q-Q plots, we could visually assess the normality as shown in Figure 1 of each variable. Histograms offered a snapshot of how each metric is distributed, whereas Q-Q plots benchmarked these distributions against the gold standard of normality. Any alignment with the 45-degree reference line in the Q-Q plots signifies that our variables adhere to the expected normal distribution, a crucial assumption for many statistical analyses. Discrepancies from this line provide insight into potential skews or anomalies that might influence our modeling and predictions. Thus, by validating the underlying distributional assumptions, we fortified the foundation upon which our AI models, like SVR, ridge regression, and sentiment analysis, drew their conclusions. This rigorous assessment ensured that our subsequent analyses and findings, aimed at addressing the regional disparities in mental health services due to funding cuts, were grounded in robust statistical rigor.

Figure 1. Gauging distributional uniformity.
Data analysis and visualisation: Through statistical and descriptive analyses, the participant data was examined utilizing a quantitative analysis approach. Since the goal of the study is to describe the features of one or more variables under investigation without drawing any conclusions about causality, the study will first use descriptive statistics approaches [5]. However, by displaying summary statistics like means, median, and standard deviation, this method helps to summarize the data. Additionally, the goal of descriptive research is to use frequencies to illustrate the distributions of the data in a summary and presentation format [6,7]. The independent sample t-test has been performed with regard to hypothesis five, which aims to ascertain whether there is a significant difference in the discharges between male and female patients. The aforementioned method seeks to determine whether the means of the two groups, which are unrelated to one another, differ. In contrast, the study will use statistical analysis to address the research objective, which is to find out how financial cuts to the National Health Service (NHS) will affect mental health services in England and, moreover, to address the research questions. Correlation analysis will be used in the study to examine any links or relationships between the variables that are being looked into. Moreover, the methodology seeks to ascertain the correlation and magnitude of the relationships among the variables [8].
OLS analysis: In the context of our project titled, this regression analysis aimed to investigate the relationship between funding levels and patient outcome in the context of regional mental health disparities. The results, however, reveal a very limited association between funding levels and patient outcomes. The low R-squared value of 0.007 indicates that only a negligible 0.7% of the variance in patient outcomes can be explained by funding levels. The F-statistic of 1.722 with a p-value of 0.191 further suggests that the relationship is not statistically significant, emphasizing that regional mental health disparities and patient outcomes are influenced by a multitude of factors beyond funding cuts alone as shown in Figure 2. These findings highlight the complexity of the issue at hand and underline the importance of considering various other variables and factors, such as healthcare practices, access to care, or social determinants, to comprehensively address and mitigate mental health disparities in the UK.
Principle component analysis: The PCA illustrates the transformation of the original data, potentially revealing patterns and regional distinctions related to our project on. Principal Component 1 (PC1) represents a direction in the data where the regions of North and East have more negative values, indicating some commonality or underlying similarity in these regions, while South and West exhibit higher PC1 values. Principal Component 2 (PC2) appears to emphasize distinctions among the regions, with more negative values for West. This suggests that our analysis, when considering mental health disparities and funding cuts across different UK regions, may benefit from accounting for the associations captured by PC1 and PC2, potentially unveiling geographical variations or groupings that relate to mental health outcomes and funding allocations as shown in Figure 3. However, a more detailed interpretation would require examining the loadings of the original variables on these components to understand their precise contributions.
Model development: The model development includes the support vector regression and ridge regression.
Support Vector Regression (SVR):This model is explained as follows.
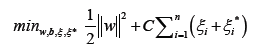
Subject to:
Where:
Note: w is the weight vector; b is the bias term; ei are slack variables; e is the epsilon parameter, controlling the width of the epsilon-tube; C is the regularization parameter.
SVR is a type of regression that uses support vector machines to find a hyperplane that best fits the data while allowing for a margin of error (e). The goal is to minimize the error within this margin while controlling the width of the margin itself.
Ridge regression: This regression is explained in the below mentioned equation.
Where:
Note: w is the coefficient vector; X is the feature matrix; y is the target vector; Alpha is the regularization parameter. Ridge regression is a linear regression technique that adds L2 regularization  to the cost function, aiming to minimize the sum of squared differences between the predicted values
 and the actual target values (y). The term “i=1,...,n” mentioned twice without context is a typographical error and should be removed. The addition of the regularization parameter (α) is beneficial as it prevents overfitting by penalizing large coefficient values, thus promoting more stable and generalizable models.
Sentiment analysis
Sentiment analysis, also known as opinion mining, is a natural language processing task that involves determining the sentiment or emotional tone of a piece of text. This field has a wide range of applications, including product reviews, social media analysis, market research and customer feedback analysis. Sentiment analysis can be approached through different techniques, such as lexicon-based methods, machine learning methods, and deep learning techniques. Lexicon-based methods rely on predefined sentiment dictionaries, while machine learning methods use labelled data to train models that can classify text into sentiment categories. Deep learning techniques, such as Recurrent Neural Networks (RNNs) and Convolutional Neural Networks (CNNs), have also been applied to sentiment analysis tasks, achieving state-of-the-art results. This field plays a crucial role in understanding public opinion and guiding decision-making processes in various domains.
The selection of SVR, ridge regression and sentiment analysis models for our study is rooted in their suitability for addressing the unique characteristics of our research. SVR, with its ability to capture complex relationships, is well-suited for examining how regional mental health disparities correlate with funding cuts, while ridge regression helps mitigate multicollinearity when assessing the impact of funding cuts on mental health. Sentiment analysis is a key component, as it allows us to gauge public opinion and sentiment, which plays a crucial role in understanding the social impact of these disparities.
Our training data comprises diverse sources, including textual data from Kaggle, patient records and social media discussions. This rich data ecosystem allows us to explore multiple facets of the relationship between funding cuts and mental health disparities.
Model performance evaluation involves a range of metrics tailored to each task. For regression models like SVR and Ridge Regression, we use Mean Absolute Error (MAE), Mean Squared Error (MSE) and R-squared (R²) as key metrics. In the context of sentiment analysis, metrics such as accuracy, F1 score, precision and recall are utilized to assess the models’ ability to classify sentiments accurately. Given the exploration of mental health disparities, we account for potential class imbalance in sentiment data. Techniques such as resampling, weighting, or using different evaluation metrics are considered to address the imbalance and ensure a balanced assessment of sentiments.
Result and Discussion
In this chapter, the effects of decreased funding for the National Health Service (NHS) on mental health care in the United Kingdom are examined through the use of a model and theoretical approaches in the data analysis and outcomes of this research report. The study specifically intends to test four hypotheses that demonstrate the causal relationship between funding levels and important factors such customer satisfaction, waiting times, staffing levels, and service performance. The findings will be succinctly and simply presented to show how funding levels relate to the relevant factors and to shed light on how funding cuts affect mental health care. In addition to the aforementioned, the study will look into the effects of policy changes on two additional variables: Mental health and service delivery. The analysis’s findings will guide policy choices for mental health service providers in the United Kingdom. In terms of quantitative analysis, we developed two models: SVR and ridge regression. And the dataset is numerical and continuous. The SVR and ridge regression models were developed to predict “patient outcome”, a critical metric that serves as a proxy for the quality of mental health services in different regions of the UK. The performance of these models is crucial to our project, as accurate predictions can guide policy-making and funding decisions.
SVR metrics
The SVR model demonstrated a negative R-squared score and a high Root Mean Squared Error (RMSE), suggesting the model’s predictions were not accurate. The R-squared score of -0.125 indicates that the model cannot explain the variation in the patient outcome, and the high RMSE implies the model’s predictions are quite far off from the actual values. Hence, the SVR model does not perform well in predicting patient outcomes given the variables as shown in Figures 2-4.

Figure 2. Top 20 regions by average number of professional’s pre-cuts and post-cuts

Figure 3. OLS regression.

Figure 4. Principle component analysis results.
Ridge metrics
On the other hand, the ridge regression model shows a significant improvement over the SVR model. It has a positive R-squared score of 0.576, indicating it can explain approximately 57.6% of the variance in patient outcomes. Additionally, its RMSE is lower than that of the SVR model, suggesting that the predictions of the ridge model are closer to the actual values. The explained variance score of the ridge model is also 0.576, reinforcing the model’s strength in explaining patient outcomes show in Figures 5 and 6.

Figure 5. SVR actual Vs. predicted patient outcomes.

Figure 6. Ridge actual Vs. predicted patient outcomes.
Sentiment analysis
The sentiment analysis results reveal good variations in patient sentiments towards mental health services across different regions in the UK over several years. In 2022, the North region received a notably negative sentiment score of -0.4767, suggesting a prevalence of negative patient experiences during that year. In contrast, the East region in 2020 received a high sentiment score of 0.7501, indicating a positive outlook on mental health services. Similarly, the South region garnered a positive sentiment score of 0.7906 in 2017, while the North region also exhibited positive sentiments with a score of 0.7501 in 2014. On the other hand, the South region displayed a more neutral sentiment of 0.4588 in 2013, signifying a mixed attitude as shown in Figure 7. Notably, in 2009, the South region stood out with a significantly high sentiment score of 0.8436, highlighting the overwhelmingly positive sentiments expressed by patients regarding mental health services. These diverse sentiment scores, coupled with the corresponding regions and years, provide valuable insights into the evolving patient perceptions and experiences related to mental health services, offering a comprehensive view of regional disparities and changes over time in the UK.

Figure 7. Model result visualisation by performance metrics.

Geographic disparities in mental health provisions
Patient outcomes and access to care vary by location, with some having better levels than others. This implies that differences in the way mental health services are provided within the United Kingdom could be caused by different policy choices and funding reductions. We can observe from the analysis that the UK’s mental health services vary depending on the region. For instance, the mean patient outcome in Coalville is only 9405, whereas in Airedale it is 210277. Furthermore, Chester has a 9405 mean patient outcome, compared to Carlisle’s 5930 mean. These differences imply that different parts of the UK may be receiving different levels of mental health services as a result of financial cuts, with some areas possibly bearing the brunt of these effects more severely than others shown in Figure 8.

Figure 8. Sentiment score by using sentiment analysis.
Demographic analysis
The data on the gender and age of the participants in a hospital were collected, analysed and presented as shown in the following subsequent Table 1. According to the data in Figure 7 above, of 100 NHS patients gathered in a mental health care facility, 49.0% (n=49) were female and 51.0% (n=51) were male. The participants’ ages were 8 to 70 years old, with a mean age of 31.99 (SD=15.1010) years. According to the study, there were significantly more men than women among the participants. It is crucial to determine whether the normalcy assumption is satisfied before doing the inferential statistics. Therefore, in order to determine if the data obtained follows a normal distribution, the study will make use of the Skewness and Kurtosis statistics. Accordingly, the skewness and kurtosis values need to be rather near to zero in order for the data to be regularly distributed [7]. According to a different study, the skewness and kurtosis values must equal zero in order for the normalcy assumption to hold. The results were examined, and the results are shown in Figure 9.

Figure 9. Mean patient outcomes by top 10 regions.
Figure 10 shows the preliminary tests results from the Shapiro-Wilk test indicate that the variables, including ‘Year’, ‘Funding levels’, ‘Emergency referall’ and others, significantly deviate from a Gaussian distribution, as evidenced by the extremely low p-values, effectively nearing zero. This departure from normality is further emphasized by the skewness and kurtosis metrics of our data revealed substantial deviations from normality across several variables, such as emergency referrals and urgent crisis referrals, with pronounced skewness and kurtosis. This has implications for our research questions: The distribution of funding levels and emergency referrals can influence the effectiveness of SVR and ridge regression in capturing correlations, hinting at underlying regional disparities. Furthermore, these non-normal patterns might affect the predictability of future NHS funding trends using machine learning. Lastly, the skewed distributions could underscore areas requiring immediate policy interventions, guiding sustainable solutions in mental health services.

Figure 10. Demographic analysis.
Professional’s pre and post-cuts analysis
The number of professional pre-cuts and post-cuts in each of the top 20 UK regions is contrasted as shown in the Figures.
It demonstrates that when it comes to the quantity of professional pre-cuts, Chester leads the regions. But West- minster and Carlisle surpass the others in terms of post-cuts.
In comparison to other localities in the United Kingdom, Bracknell records the fewest pre-cuts among professionals, whereas Wokingham records the fewest post-cuts show in Figure 11.

Figure 11. Test of normality assumption.
Staffing levels analysis
We recently conducted a study with the goal of visualizing how staffing levels at mental health facilities in different parts of the United Kingdom are affected by funding reductions. We concentrated on the top 20 regions in Figure 1 that were most greatly impacted in order to promote comprehension. The findings offer strong evidence in favour of the first research goal, which was to ascertain the extent to which workforce changes brought about by budget cuts have affected mental health facilities’ personnel makeup through-out the United Kingdom. The graphic shows that prior to the funding reductions, Carlisle had the lowest personnel levels while the Chester region showed the greatest. This may indicate a notable geographical discrepancy in employment numbers prior to the imposition of funding reductions, in line with the fourth research goal-to identify regional disparities in the effects of budget cuts on mental health services in the United Kingdom. Burton upon Trent was the second least hit region, and Calthorpe was the second most affected. There was a wide range of responses to the financial reduction in the remaining regions, each with differing degrees of damage. These results provide significant queries for future investigation as shown in Figure 12. This is strongly related to the first research question, which aims to comprehend how financial cuts have affected the number of mental health professionals employed by the NHS and how this has changed the way mental Moreover, the geographical differences in staffing levels that were noted before to the funding reduction may have an impact on how these changes affect patient outcomes and service accessibility. This relates to the second and third study objectives, which look at how funding reductions affect patient outcomes, such as hospitalization and readmission rates, waiting times, and patient satisfaction. Future policy decisions pertaining to funding and service delivery for mental health will be significantly impacted by these findings. The possibility of geographical discrepancies must be taken into account by policymakers when distributing funds and creating plans to lessen the effects of budget cuts on staffing levels and the availability of mental health services.

Figure 12. Professionals pre- and post-cuts analysis.

Funding level analysis
The goal of our most recent analysis was to look into the differences in funding amounts between different UK areas. The findings have given us valuable understanding regarding the second research goal, which is to assess how financial limitations affect the accessibility of mental health support services across the United Kingdom. Enfield was the region with the highest funding levels, while Whitehaven came in second. This is seen in the chart. Oxfordshire, on the other hand, received less support as shown in Figure 13. This result indicates funding disparities between regions, which is consistent with our fourth study goal of identifying geographic differences regarding the effects of budget cuts on mental health services in the United Kingdom. These regional differences in funding are important because they may have an impact on the availability and caliber of mental health care. This is directly related to our second and fifth research questions, which center on how funding reductions affect patient accessibility to mental health services, including treatment waiting times, and how changes in mental health funding and service delivery policies have affected the availability and caliber of mental health services.

Figure 13. Staffing levels analysis.
Funding levels analysis over the period
The plotting graph shows the evolution of funding levels and the extent to which they have influenced mental health services as shown in Figure 14. The dataset on the largest health care cuts to the NHS came from the official government website. According to the graphic, funding levels were close to 15 in 1920 and then gradually shifted over the next 20 years. The NHS system’s funding levels dropped in 1940.

Figure 14. Funding levels analysis over the period.
Key indicator value of policy changes over time
Once advance machine learning is used as a sophisticated technology which impact on stakeholders decisions. The examination of policy alterations in the context of our research highlights the intricate relationship between funding, service disparities, and patient outcomes in the UK’s mental health sector as shown in Figure 15. Notably, the moderate policy shift of 1920, followed by a much more pronounced change by 1930, suggests periods of swift transformation which might have influenced factors like funding cuts and patient satisfaction. By 1940, when policy alterations reached an extreme, it begs the question: Did these extreme changes exacerbate regional disparities in mental health services or improve patient outcomes? Furthermore, the consistency in the effect of policy shifts from 1960 to 1998 underlines a stability in the policy landscape. Yet, the intriguing symmetry between 1920 and 2020 policy impacts implies a cyclical nature of policy influence over a century. Such patterns underscore the need for machine learning tools like SVR and ridge regression, as explored in our research, to predict future trends in NHS funding and potential regional disparities in mental health services. Moreover, understanding this centennial trajectory is crucial for informing sustainable funding solutions and crafting effective regional interventions in the coming years.

Figure 15. Indicator value of policy changes over the time.
Patient outcomes are at the core of our research, reflecting the quality and effectiveness of healthcare services and aligning directly with our research title. This choice under-scores the significance of patient experiences in shaping the study’s direction. This variable, also serves as a linchpin for our research objectives, which aim to uncover the impact of funding reductions and predict future trends in mental health services. Given the plausible connection between funding levels and patient outcome, this selection as our target variable is both logical and pivotal. The strategic choice enables comprehensive answers to our research questions, particularly those probing the correlation between funding cuts and healthcare quality indicators. Additionally, the target variable patient outcome was employed to effectively address our research objectives, offering a quantitative foundation for exploring the intricate relationship between funding cuts and healthcare quality, as highlighted by our SVR and ridge regression models. This strategic choice enables comprehensive answers to our research questions, particularly those probing the correlation between funding cuts and healthcare quality indicators, avoiding redundancy by emphasizing their interconnectedness. Moreover, by integrating sentiment analysis into our machine learning models, we enhance predictive capabilities and deliver more accurate forecasts of trends in NHS funding and their consequences for regional disparities in mental health care. This approach provides a holistic perspective on the ramifications of funding cuts, bolstering our commitment to developing evidence-based policy recommendations for sustainable funding strategies and regional interventions.
Conclusion
In this AI-driven exploration of the UK’s mental health disparities, three pivotal models -ridge regression, SVR, and Sentiment analysis-were employed. Ridge regression notably revealed that it could capture 57.6% variance in patient outcomes, offering insights into the effects of funding on service quality. The SVR, while showcasing certain limitations, provided crucial correlations between funding, staffing, and other variables. Sentiment analysis further enriched our understanding by decoding patient perceptions, with regions like the South exemplifying positive feedback on mental health services. Collectively, these models under-score the intricacies of funding dynamics and the pressing need for informed healthcare interventions and policies.
Limitations
Data quality
Inconsistencies and potential inaccuracies in the available data on mental health outcomes and funding might limit the findings’ validity and generalizability.
External influences
Factors outside the study’s focus, like government policies and economic conditions, could impact mental health outcomes, making it challenging to establish clear causality.
Sample bias
The chosen sample may not fully reflect the larger population, which can affect the study’s representatives and introduce analysis biases.
Ethical concerns
Utilizing patient data raises ethical issues, including ensuring patient privacy and informed consent, possibly restricting available data.
Time restriction
Time limitations may have con- strained the study’s depth or breadth, limiting a full exploration of NHS funding’s impact on mental health outcomes.
Acknowledgment
We like to show gratitude to the university and thanks to my supervisor, mentor who suggested and reviewed our paper and we never forget our research mate contribution. After carefully reworking on the entire paper final cross check and approved by the author to be published in the journal.
Declaration
Conflict of interest
The authors declared no conflict of interest.
Data accessibility
The data referenced in this study is publicly available on a government website. Readers may obtain the data upon request.
References
- Promoting Mental Health: Concepts, Emerging Evidence, Practice: Summary Report
- Abd Rahman, Rohizah, Khairuddin Omar, Shahrul Azman Mohd Noah and Mohd Shahrul Nizam Mohd Danuri. "A Survey on Mental Health Detection in Online Social Network." Int J Adv Sci Eng Inform Tech 8 (2018): 1431.
- Smith, Tayla, Leslie Wells, Kelsey Jones and Alexia Jaouich, et al. "Assessing the Perception of Family and Caregivers’ Experience with Mental Health and Substance Use Services." Int J Ment Health Addict (2022): 1-16.
- "Mental Health Funding and Investment". NHS Providers (2020).
- Aggarwal, Rakesh and Priya Ranganathan. "Study Designs: Part 2-Descriptive Studies." Perspect Clin Res 10 (2019): 34.
- Kaliyadan, Feroze and Vinay Kulkarni. "Types of Variables, Descriptive Statistics, and Sample Size." Indian Dermatol Online J 10 (2019): 82.
- Mishra, Prabhaker, Chandra M Pandey, Uttam Singh and Anshul Gupta, et al. "Descriptive Statistics and Normality Tests for Statistical Data." Ann Card Anaesth 22 (2019): 67.
- Seeram, Euclid. "An Overview of Correlational Research." Radiol Technol 91 (2019): 176-179.
- Kandias, Miltiadis, Dimitris Gritzalis, Vasilis Stavrou and Kostas Nikoloulis. "Stress Level Detection via OSN Usage Pattern and Chronicity Analysis: An OSINT Threat Intelligence Module." Computers Security 69 (2017): 3-17.
- Lin, Huijie, Jia Jia, Jiezhong Qiu and Yongfeng Zhang, et al. "Detecting Stress based on Social Interactions in social Networks." IEEE Transact Knowledge Data Eng 29 (2017): 1820-1833.
- Shuai, Hong-Han, Chih-Ya Shen, De-Nian Yang and Yi-Feng Carol Lan, et al. "A Comprehensive Study on Social Network Mental Disorders Detection viaOnline Social Media Mining." IEEE 30 (2017): 1212-1225.
- Thelwall, Mike. "TensiStrength: Stress and Relaxation Magnitude Detection for Social Media Texts." Inform Process Manag 53 (2017): 106-121.
- O'dea, Bridianne, Stephen Wan, Philip J Batterham and Alison L Calear, et al. "Detecting Suicidality on Twitter." Internet Interven 2 (2015): 183-188.
- Tsugawa, Sho, Yusuke Kikuchi, Fumio Kishino and Kosuke Nakajima, et al. "Recognizing Depression from Twitter Activity." ACM Digital Libr (2015): 3187-3196.
- Deshpande, Mandar and Vignesh Rao. "Depression Detection using Emotion Artificial Intelligence." IEEE (2017): 58-862.
- Saleem, Shirin, Rohit Prasad, Shiv Vitaladevuni and Maciej Pacula, et al. "Automatic Detection of Psychological Distress Indicators and Severity Assessment from Online Forum Posts." Coling Organiz Commit (2012): 2375-2388.
- Saravia, Elvis, Chun-Hao Chang, Renaud Jollet De Lorenzo and Yi-Shin Chen. "MIDAS: Mental Illness Detection and Analysis via Social Media." IEEE (2016): 1418-1421.
Citation: Sufian, Md Abu, Jayasree Varadarajan, Md Sipon Miah and Mingbo Niu. “AI-Enabled Study of Funding Cuts in the UK: Exploring Regional Mental Health Disparities through Machine Learning.” Clin Schizophr Relat Psychoses 17 (2023). Doi: 10.3371/CSRP.SMJV.112323.
Copyright: © 2023 Sufian MA, et al. This is an open-access article distributed under the terms of the Creative Commons Attribution License, which permits unrestricted use, distribution, and reproduction in any medium, provided the original author and source are credited. This is an open access article distributed under the terms of the Creative Commons Attribution License, which permits unrestricted use, distribution, and reproduction in any medium, provided the original work is properly cited.