Research Article - Clinical Schizophrenia & Related Psychoses ( 2021) Volume 0, Issue 0
The Relationship Between Copeptin And Some Of The Biomarkers In Iraqi Myocardial Infarction Patients
Sahar FH Al-Obaidi and Shakir FT Alaaraji*Shakir FT Alaaraji, Department of Medical Parasitology, Faculty of Medicine, Cairo University, Cairo, Egypt, Email: asalantably@kasralainy.edu.eg
Received: 04-Aug-2021 Accepted Date: Aug 18, 2021 ; Published: 25-Aug-2021
Abstract
Myocardial infarction (MI) is a leading cause of death and morbidity globally, accounting for up to 40% of all deaths. Atherosclerotic inflammation is a key element in the creation of coronary plaque as well as the progression of the plaque to an unstable condition, which leads to MI. In the present paper, we attempted to measure whether there is any association of copeptin (CPP) with FSG, lipid profile, Ca+2, Fe+2, Cu+2, cTnT, and CPK-MB in Iraqi MI patients. This study included 54 MI patients from Al-Ramadi and Al-Fallujah teaching hospitals, as well as 30 healthy people who served as controls. ELISA was used to determine the level of CPP in the blood, while FSG, TG, T.Cho, HDL, CPK (MB), and cTn-T, Cu+2, Fe+2, and Ca+2 by enzymatic colorimetric methods. Serum level of CPP was higher in MI patients than in healthy people (P< 0.000l), CPP has an important positive correlation with FSG, TG, VLDL, Cu+2, and CPK. MB and cTn-T with P<0.01, the area under receiver operating characteristic (AUROC) of FSG was (0.9451), CPP (0.8596), T.Cho (0.5225), TG (0.8639), HDL (0.788), LDL (0.804), VLDL (0.8889), Ca+2 (0.7948), Fe+2 (0.6951), Cu+2 (0.6963), CPK (MB) (0.9948), cTn-T(1). Serum CPP level can be used as a tool for diagnosing MI disease. Also, FSG, CPK (MB), and cTn-T may be good biomarkers in the diagnosis of MI disease.
Keywords
Serum • Diagnosis • Copeptin • Disease
Introduction
Myocardial infarction (MI) is described as the death of myocardial cells as a result of prolonged ischemia, diminished cellular glycogen, relaxed myofibrils, and sarcolemma disruption. The earliest ultra-structural alterations appear 10 to 15 minutes after ischemia begins [1]. MI due to prolonged ischemia is known as myocardial necrosis; myocardial necrosis injury can, however, be found in conditions following non-ischemic myocardial injury, including heart failure, myocarditis, arrhythmias, renal failure, pulmonary embolism, and other very simple percutaneous or surgical treatments [2].
Copeptin (CPP) is stored as AVP in the same neuro secretory granules, leading to co-secretion when plasma osmolality and volume depletion are increased and rapid suppression when plasma osmolality is increased Intake of fluid (load or infusion of oral water [3]. CPP levels have been shown to be substantially higher in women than in men; after as little as a quart of water, there is a drop in blood pressure [4]. CPP can have prognostic value not only in the short term but also in recognizing patients who are at higher long-term risk, elevated concentrations of CPP in the Elderly Patients with heart failure symptoms were related after a heart attack, there's a greater likelihood of dying from any cause. [5]. Serum CPP has recently been tested among male Iraqi with chronic kidney disease [6]. Unlike cTn, copeptin release is non-specific and can be induced by a variety of acute clinical situations such as acute heart failure, pulmonary embolism, and sepsis [7]. However, Stallone et al. discovered that there is a strong link between high copeptin levels and mortality, which can be explained by age and comorbidities. [8]
The key explanation for the cTn test was that myocardial necrosis causes membrane destruction, which causes troponin to be released and detected in the bloodstream [9]. The amount of cTn in the cytosolic pool is equivalent to that of CK-MB; however, per gram of cTn in the myocardium, it is 13 to 15 times higher than CK-MB due to a large amount of cardiac troponin in the contractile device. We can see why troponin is more responsive than CK-MB because cTn levels increase in the peripheral blood, while CK-MB normal levels are less than 1 gram, after inflammation, ischemia, toxic injury, or infarction have caused myocardial damage [10].
Calcium is considered to be essential in the pathophysiology of a variety of diseases, and this is particularly true when it comes to the cardiovascular system and the diseases that it causes; calcium affects blood pressure since it is involved in the process of vasoconstriction, calcium ions are also an important component of electrical conduction in the heart [11]. In 2019, a study was conducted by Yuan, Insulin resistance, hyper insulinemia, and vascular calcification are common in diabetic individuals, which not only increase atherosclerosis but also speed the development of stable plaques into unstable plaques or plaque rupture, resulting in blood clotting and adverse coronary artery events [12]. Iron is needed for the human body to function properly; as a result, it is a part of several proteins and is a central micronutrient in metabolism and enzymes that play a role in biological processes, including transport and storage of oxygen [13].
In 2020, Ravingerová, T researchers discovered that Iron deficiency had been shown to impair the contraction of human heart muscle cells by decreasing their mitochondrial function and energy production, which reduces the ability of the heart to function, leading to coronary artery disease and myocardial infarction in the population [14].
The main goal of this study was to determine the serum level of CPP in MI patients and controls to explore the correlation between CPP with a number of biochemical variables in Iraqi MI patients.
Materials and Methods
This data contains fifty-four patients with MI, and 30 HCs were recorded in the study, age range within 45-70 year randomly chosen from Al-Anbar Governorate those attending in Ramadi teaching hospital and Al-Fallujah teaching hospital between September 2020 to December 2020.
Rejection principles for MI patients: were empty of severe diseases or contagion at time of study also those with known illness.
Rejection principles for HCs: Were chosen Among those who were healthy control and did not have diabetes, hypertension, and ischemic heart disease, the rest had no history of smoking or drinking alcohol, they also did not have severe disease or infection at the time of sampling, HCs were not specific to any prescribed drugs or dietary restrictions and other diseases were excluded, they apparently seem healthy. Blood samples from MI patients and HCs were obtained early in the morning (8-10:30 am) after fasting for 12 hours overnight.
The Anthropometric Measurement (AMs) were performed for all participants in the study BMI was calculated by dividing weight (kg) by height squared (m2). Measurement Waist Circumference (WC) and Hip Circumference (HC), and the waist to hip circumference ratio were calculated as the WC divided by the HC. All biochemical parameters were measured by enzymatic methods and with commercial kits (Spain, Linear), and the level of CPP was measured by Elisa kit (BT LAB China).
Statistics
Graph Pad Prism 7.04 was used to conduct statistical analyses of our findings (Graph Pad Software, La Jolla, CA, USA). The consequences are called the mean, Standard Error of the Mean (SEM), and Standard Deviation (SD). A t-test was used to confirm the statistical significance of the differences between subjects with and without MI, two-tailed Pearson correlations were used to test bivariate associations, and the investigation's accuracy was determined using The area under the ROC curve. The significance level was set at P=0.05.
Results
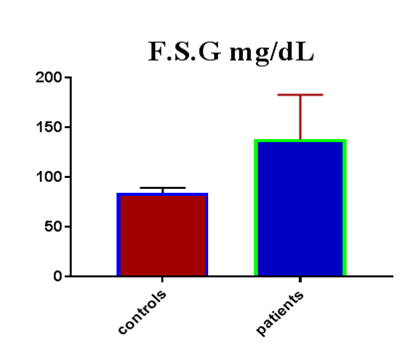
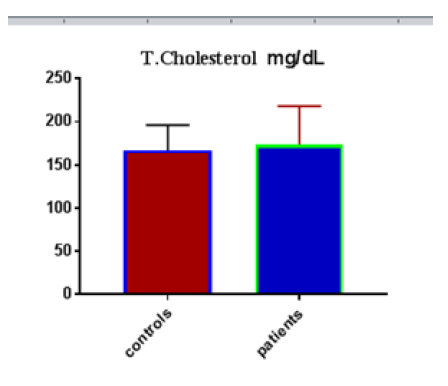
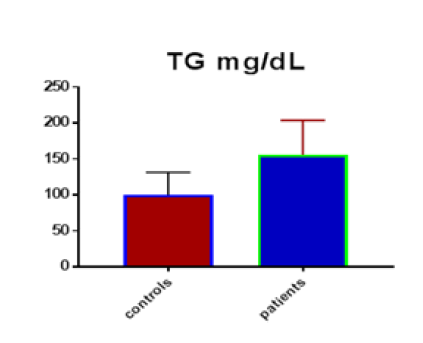
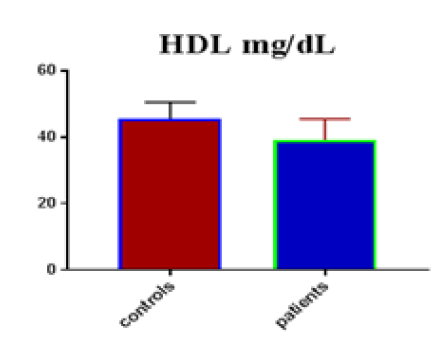
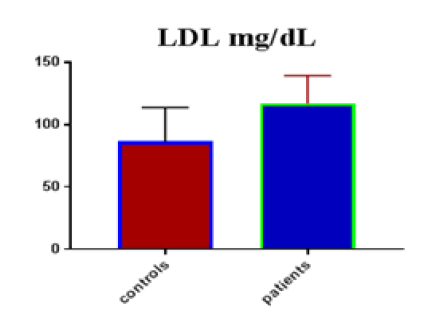
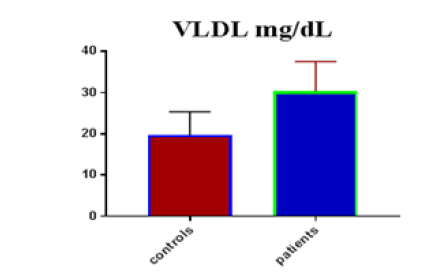
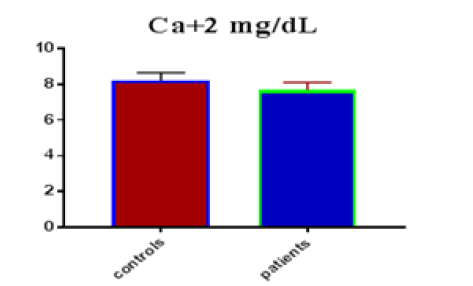
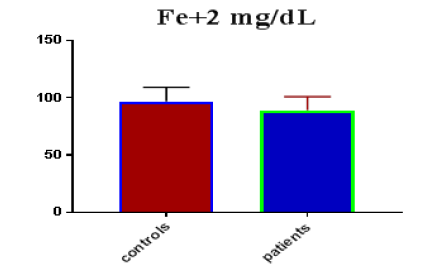
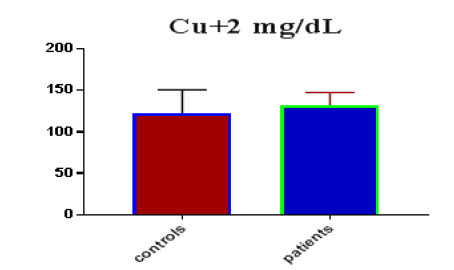
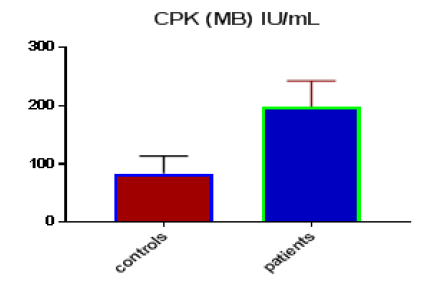
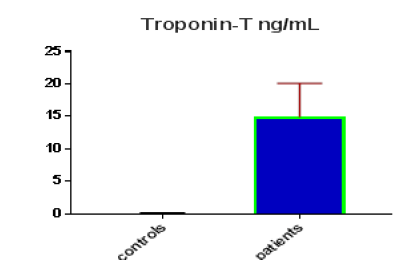
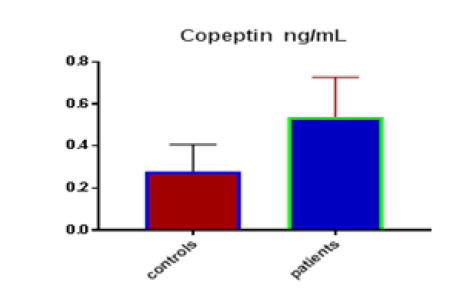
Table 1 shows the subjects' standard experimental characteristics, had serum copeptin levels (ng/mL) were higher in MI patients than in HCs (0,5384 vs.0,279) with p-value less than 0.0001 as shown in Figure1 also FSG, T. Cho, TG, LDL, VLDL, Ca+2, Cu+2, CPK (MB) and cTn-T were higher in MI patients than in HCs with P<0.000l for all parameters, while T. Cho has P=0.4792, but HDL and Fe+2 were lower in MI patients than in controls with p=0.01, as shown in Table 1 and Figures 2-12 respectively.
| Parameters | Controls | Patients | |||||
|---|---|---|---|---|---|---|---|
|
|
Mean | SD | SEM | Mean | SD | SEM | P -value |
| FSG mg/dL | 84.73 | 5.01 | 0.9147 | 138.3 | 44.83 | 6.101 | <0.0001 |
| T.cholesterol mg/dL | 166.90 | 29.34 | 5.356 | 173.4 | 44.90 | 6.109 | 0.4792 |
| TG mg/dL | 99.87 | 31.44 | 5.739 | 155.6 | 48.32 | 6.575 | <0.0001 |
| HDL mg/dL | 45.67 | 4.866 | 0.8884 | 39.2 | 6.37 | 0.867 | <0.0001 |
| LDL mg/dL | 86.41 | 27.44 | 5.011 | 116.8 | 22.63 | 3.079 | <0.0001 |
| VLDL mg/dL | 19.63 | 5.711 | 1.043 | 30.3 | 7.25 | 0.987 | <0.0001 |
| Ca+2 mg/dL | 8.20 | 0.442 | 0.0807 | 7.67 | 0.44 | 0.060 | <0.0001 |
| Fe+2 mg/dL | 96.78 | 12.26 | 2.239 | 88.96 | 11.92 | 1.621 | 0.0055 |
| Cu+2 mg/dL | 122.30 | 28.61 | 5.223 | 132.1 | 15.78 | 2.147 | 0.0467 |
| CPK (MB) IU/mL | 83.47 | 30.08 | 5.491 | 198.2 | 44.84 | 6.102 | <0.0001 |
| Troponin-T ng/mL | 0.11 | 0.049 | 0.0089 | 14.9 | 5.17 | 0.704 | <0.0001 |
| Copeptin ng/mL | 0.28 | 0.127 | 0.0232 | 0.538 | 0.19 | 0.026 | <0.0001 |
Significant positive correlations were detected of copeptin with FSG, TG, VLDL, Cu, CPK (MB) and cTn-T (r=0.312, P=0.004), (r=0.335,P=0.002), (r=0.324,P=0.003), (r=0.371,P<0.001), (r=0.484,P<0.001) and (r=0.553, P<0.001) respectively while negative correlations of copeptin with HDL (r=- 0.380, p<0.001), was detected as shown in Table 2.
|
Parameters |
r |
p-value |
|---|---|---|
| Copeptin ng/mL | ||
| FBS miligram / dL | 0.312 |
0.004 |
| T.cholesterol miligram /Dl | -0.018 |
0.869 |
| Triglycerides miligram / dL | 0.335 |
0.002 |
| HDL miligram / dL | -0.380 |
<0.001 |
| LDL miligram / dL | 0.214 |
0.051 |
|
VLDL miligram / dL |
0.324 |
0.003 |
| S.Ca+2 miligram / dL | -0.193 |
0.079 |
| S.Fe+2 miligram / dL | -0.160 |
0.147 |
| S.Cu+2 miligram / dL | 0.371 |
<0.001 |
|
CPK-MP IU/mL |
0.484 |
<0.001 |
|
Troponin-T IU/mL |
0.553 |
<0.001 |
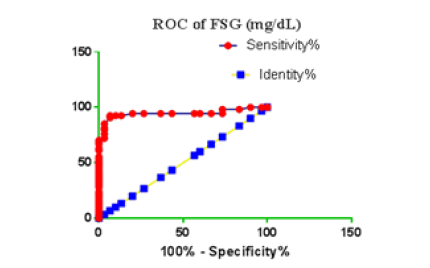
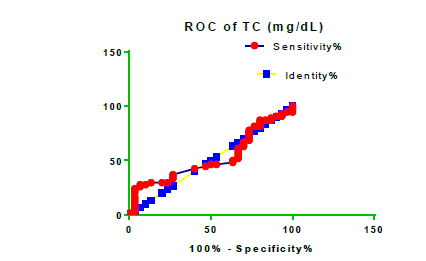
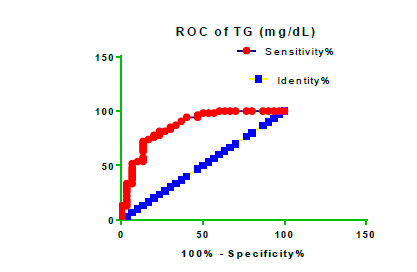
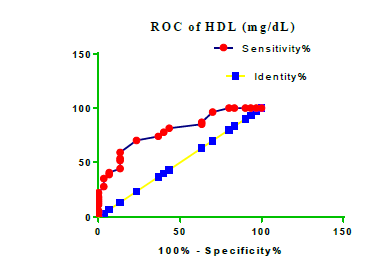
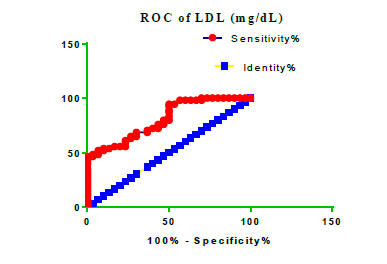
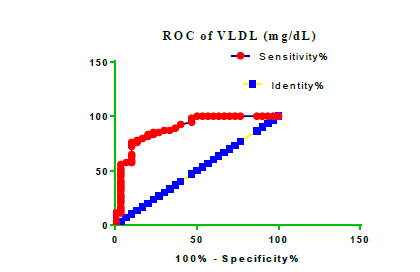
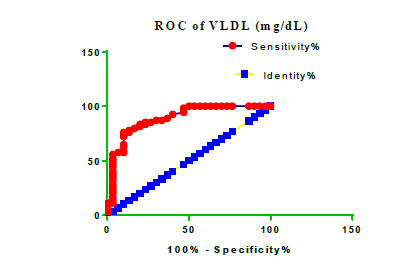
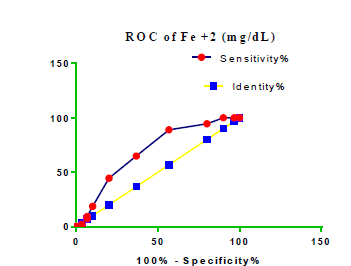
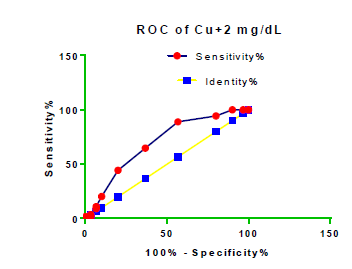
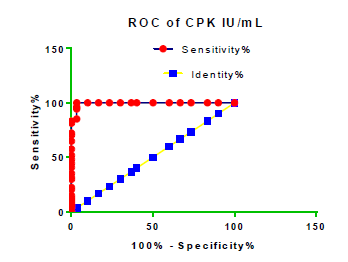
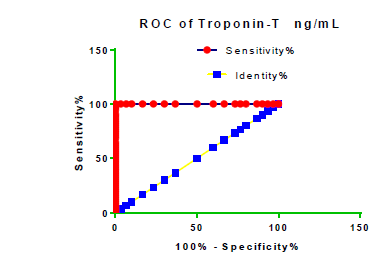
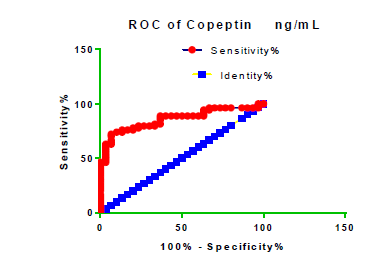
Receiver Operating Characteristic (ROC) curve checking offered that the best biomarkers were fit to distinguish patients with MI from HCs is FSG [AUC=0.9451; P<0.0001; 95% Confidence Interval (CI): Between 0.8938 and 0.9963, SE:0.02614 as shown in Table 3 and Figure 13 while T. cholesterol was found to be a better predicator for MI (AUC=0.5225; P=0.7333; 0.3961 to 0.649, SE:0.0645) as shown in Table 3 and Figure 14 and TG (AUC= 0.8639; P=<0.0001; 95% CI: Between 0.7779 and 0.9498 and SE:0.04385) as shown in Table 3 and Figure 15. HDL (AUC=0.788; P<0.0001;95% CI: Between 0.6903 and 0.8856, SE:0.04983), LDL (AUC=0.804; P<0.0001; 95% CI: Between 0.7108 and 0.8972, SE:0.04754), VLDL (AUC=0.8889; P<0.0001; 95% CI: Between 0.8122 and 0.9656, SE:0.03914), Ca (AUC=0.7948; P<0.0001; 95% CI: Between 0.6977 and 0.8918, SE:0.04952], Fe [AUC=0.6951; P=0.0032; 95% CI: Between 0.5815 and 0.8087, SE:0.05796),Cu (AUC=0.6963; P=0.0030; 95% CI: Between 0.574 and 0.8186, SE:0.06239), CPK (MB) ( AUC=0.9948; P<0.0001; 95% CI: Between 0.9837 and 1.006, SE:0.005652), Troponin-T (UC=1; P<0.0001; 95% CI:1to1, SE:0),Copeptin (AUC=0.8596; P <0.0001; 95% CI: Between 0.7811 and 0.938, SE:0.04002) respectively, as shown in Table 3 and Figures 16-24. respectively.
| Parameters |
AUC |
Std. Error | 95% confidence interval | P-value |
|---|---|---|---|---|
| FSG miligram /dL | 0.9451 | 0.02614 | Between 0.8938 and 0.9963 | <0.0001 |
|
T. cholesterol miligram /dL |
0.5225 | 0.0645 | Between 0.3961 and 0.649 | 0.7333 |
| TG miligram /dL | 0.8639 | 0.04385 | Between 0.7779 and 0.9498 | <0.0001 |
| HDL miligram /dL | 0.788 | 0.04983 | Between 0.6903 and 0.8856 | <0.0001 |
| LDL miligram /dL | 0.804 | 0.04754 | Between 0.7108 and 0.8972 | <0.0001 |
| VLD miligram /dL | 0.8889 | 0.03914 | Between 0.8122 and 0.9656 | <0.0001 |
| Ca +2 miligram /dL | 0.7948 | 0.04952 | Between 0.6977 and 0.8918 | <0.0001 |
| Fe+2 miligram /dL | 0.6951 | 0.05796 | Between 0.5815 and 0.8087 | 0.0032 |
| Cu+2 miligram /dL | 0.6963 | 0.06239 | Between 0.574 and 0.8186 | 0.0030 |
| CPK (MB) IU/ml | 0.9948 | 0.005652 | Between 0.9837 and 1.006 | <0.0001 |
| Troponin-T ng/ml | 1 | 0 | 1 to 1 | <0.0001 |
| Copeptin ng/ml | 0.8596 | 0.04002 | 0.7811 to 0.938 | <0.0001 |
Discussion
Many different studies reference the relationship between T.Cho, TG, LDL, and MI, and MI risk factors in patients with high T. Cho, TG, LDL levels in patients and controls. The results of our study agreed with many previous studies, one of them which observed that lipid complications contain not only quantitative but also qualitative abnormality of lipoproteins that are likely atherogenic, quantitative abnormalities include elevated levels of overall serum T.Cho, TG, LDL, as well as reduced levels of HDL [15]. The rates of TG and VLDL in the MI population were substantially higher than in the control community in this study, which was consistent with other studies [16].
In this study, the findings showed significant differences in Ca+2, Fe+2, Cu+2 ions levels between patients and control groups, suggesting that these ions levels in research cases very effective in heart disease, especially MI. Several studies suggested that the low level of calcium in the serum is a major cause of MI, as the results of our current study showed that there is a close relationship between low calcium ions levels and MI patients, and this is in line with another study, which demonstrated that low serum calcium levels were one of the independent factors connected with MI after controlling for age, sex, hypertension, smoking, and serum phosphorus, T.Cho, LDL,HDL and FSG [17,18], this study agrees with the previous study which showed good relation in loss calcium level in MI patients than in HCs with p-value<0.05 [19].
Data of this study showed good relation in loss serum iron level in MI patients than HCs with p-value<0.05 [20]. In humans, iron can cause lipid peroxidation, which has been linked to ischemic myocardial injury [21]. Atherosclerosis is believed to be caused by the degradation of low- LDLs. Copper deficiency increasing levels of LDL and other lipoproteins such as High-Density Lipoprotein (HDL) and Very-Low-Density Lipoprotein (VLDL) more susceptible to oxidation. When lipoproteins from copper-deficient animals are exposed to oxidative reactions involving iron, they produce more thiobarbituric acid reactive substances, indicating that copper can protect against iron-induced oxidation. Copper ions can catalyze lipoprotein oxidation, but enzymes must contain it to prevent oxidative modification. A copper deficiency in the body may lead to LDL oxidation, poor antioxidant enzyme levels, and dysfunctional mitochondria, all of which may contribute to MI development [22,23].Our study results are inconsistent with several studies [24,25]. The role of trace elements in the formation and progression of CVD is becoming more widely understood in MI. However, there isn't always a clear cause-effect association between the production of MI and trace element status [26]. This Troponin T protein has yet to be extracted from skeletal muscle. It's highly accurate as it relates to myocardial damage [27]. They enter the bloodstream 6-8 hours after myocardial infarction, reach a plateau between 12 and 24 hours, and remain increased for 7 to 10 days [28]. Creatine kinase is found throughout the body and is unspecific for myocyte damage; however, CK-MB is a myocardial tissue-specific enzyme. CK-MB can be identified in serum after 4 to 6 hours following Myocardial ischemia began, although it may take 12 hours for some people. CK-MB levels are frequently used to monitor for reinfection since they recover to normal within 36 to 48 hours of the intervention. Because CK-MB is produced by weakening skeletal muscle, it should be used with caution if skeletal muscle damage or disease is still suspected [29].
Copeptin is now widely recognized as a quantifiable endogenous stress marker. Acute myocardial infarction, for example, causes it to grow fast. A single variable, it has only limited diagnostic sensitivity for an acute MI. In a dual-marker strategy, however, combining copeptin with standard cardiac troponin improves diagnostic accuracy and, in particular, the adverse predictive benefit of cardiac troponin alone for an acute MI, so our results correspond to many studies that show a significant increase in diagnostic sensitivity for acute myocardial infarction [30,31]. CPP is a nonspecific marker, but its concentration rises early in an acute instance of AMI, most likely as a result of a decrease in cardiac activity and/or blood pressure, making the pathophysiological model for ruling out AMI simple. Troponin, on the other hand, is 100% cardio-specific, although its concentration takes time to rise after myocardial necrosis [32].
Conclusion
Myocardial Infarction (MI) is a leading cause of death and morbidity globally, accounting for up to 40% of all deaths. Atherosclerotic inflammation is a key element in the creation of coronary plaque as well as the progression of the plaque to an unstable condition, which leads to MI. The current study found that the patients with MI have High levels of serum Copeptin, which may be the cause of their various complications during the disease course, and this may be used as possible biomarkers and predictor of MI, also they may be used in the manufacture of new treatments for MI disease.
References
- Kristian Thygesen, Joseph S Alpert, Allan S Jaffe and Bernard R Chaitman, et al. “Fourth Universal Definition of Myocardial Infarction.” J Am Coll Cardiol 72(18): 2231-64.
- Thygesen, Kristian, Joseph S Alpert, Allan S Jaffe and Maarten L Simoons, et al. “Third Universal Definition of Myocardial Infarction.” Nat Rev Cardiol 9 (2012): 620-633.
- Balanescu, Sandrina, Peter Kopp, Mary Beth Gaskill and Nils G Morgenthaler, et al. “Correlation of Plasma Copeptin and Vasopressin Concentrations in Hypo-, Iso-, and Hyperosmolar States.” J Clin Endocrinol Metab 96 (2011): 1046-1052.
- Walti, Carla, Judith Siegenthaler, and Mirjam Christ-Crain. “Copeptin Levels are Independent of Ingested Nutrient Type After Standardised Meal Administration–the CoMEAL Study.” Biomarkers 19 (2014): 557-562.
- Alehagen, Urban, Ulf Dahlström, Jens F Rehfeld and Jens P Goetze. “Association of Copeptin and N-terminal ProBNP Concentrations with Risk of Cardiovascular Death in Older Patients with Symptoms of Heart Failure.” Jama 305 (2011): 2088-2095.
- Alaaraji, Shakir FT, Muthanna M. Awad and Mohammed A. Ismail. “Study the Association of Asprosin and Dickkopf-3 with KIM-1, NTpro-BNP, GDF-15 and CPP Among Male Iraqi with Chronic Kidney Disease.” System Rev Pharmacy (2020): 10-17.
- Hellenkamp, Kristian, Piotr Pruszczyk, David Jiménez and Anna Wyzgal, et al. “Prognostic Impact of Copeptin in Pulmonary Embolism: A Multicentre Validation Study.” Eur Respir J 51 (2018): 1702037.
- Sun, Xiang, Carrie Allison, Liping Wei, and Fiona E Matthews et al. “Autism Prevalence in China is Comparable to Western Prevalence.” Mol Autism 10 (2019): 1-19.
- Park, Kyung Chan, David C Gaze, Paul O Collinson and Michael S Marber. “Cardiac Troponins: From Myocardial Infarction to Chronic Disease.” Cardiovasc Res113 (2017): 1708-1718.
- Aydin, Suleyman, Kader Ugur, Suna Aydin and Ibrahim Sahin, et al. “Biomarkers in Acute Myocardial Infarction: Current Perspectives.” Vasc Health Risk Manag15 (2019): 1-10.
- Schmitz, Timo, Christian Thilo, Jakob Linseisen and Margit Heier, et al. “Low Serum Calcium is Associated with Higher Long-Term Mortality in Myocardial Infarction Patients from a Population-Based Registry.” Sci Rep 11 (2021): 1-8.
- Yuan, Ting, Ting Yang, Huan Chen and Danli Fu, et al. “New Insights into Oxidative Stress and Inflammation During Diabetes Mellitus-Accelerated Atherosclerosis.” Redox Biol 20 (2019): 247-260.
- Wilson, Michael T, and Brandon J Reeder. “Oxygen-Binding Haem Proteins.” Exp Physiol 93 (2008): 128-132.
- Ravingerová, Tanya, Lucia Kindernay, Monika Barteková and Miroslav Ferko, et al. “The Molecular Mechanisms of Iron Metabolism and its Role in Cardiac Dysfunction and Cardioprotection.” Int J Mol Sci 21(2020): 7889.
- Wang, William T, Anne Hellkamp, Jacob A Doll and Laine Thomas, et al. “Lipid Testing and Statin Dosing After Acute Myocardial Infarction.” J Am Heart Assoc 7 (2018): e006460.
- Holmes, Michael V, Iona Y Millwood, Christiana Kartsonaki and Michael R Hill, et al. “Lipids, Lipoproteins, and Metabolites and Risk of Myocardial Infarction and Stroke.” J Am Coll Cardiol 71 (2018): 620-632
- Catalano, Antonino, Giorgio Basile, and Antonino Lasco. "Hypocalcemia: a sometimes overlooked cause of heart failure in the elderly.” Aging Clin Exp Res 24 (2012): 400-403.
- Newman, Darrell B, Salman S Fidahussein, Deanne T Kashiwagi and Kurt A Kennel, et al. “Reversible Cardiac Dysfunction Associated with Hypocalcemia: A Systematic Review and Meta-Analysis of Individual Patient Data.” Heart Fail Rev 19 (2014): 199-205.
- Wang, Yong, Heng Ma, Xiaochen Hao and Jun Yang, et al. “Low Serum Calcium is Associated with Left Ventricular Systolic Dysfunction in a Chinese Population with Coronary Artery Disease.” Sci Rep 6 (2016): 1-7.
- Magnusson, Magnus K, Nikulas Sigfusson, Helgi Sigvaldason and GM. Johannesson, et al. “Low Iron-Binding Capacity as a Risk Factor for Myocardial Infarction.” Circulation 89 (1994): 102-108.
- Ravingerová, Tanya, Lucia Kindernay, Monika Barteková and Miroslav Ferko, et al. “The Molecular Mechanisms of Iron Metabolism and its Role in Cardiac Dysfunction and Cardioprotection.” Int J Mol Sci 21 (2020): 7889.
- Di Nicolantonio, James J, Dennis Mangan and James HO’Keefe. “Copper Deficiency May be a Leading Cause of Ischaemic Heart Disease.” Open Heart 5 (2018): e000784.
- He, Weihong and Y James Kang. “Ischemia-Induced Copper Loss and Suppression of Angiogenesis in the Pathogenesis of Myocardial Infarction.” Cardiovasc Toxicol 13 (2013): 1-8.
- Kosem, Arzu, Aylin Hakligor and Dogan Yucel. “Effects of Calcium (II), Magnesium (II), Copper (II) and Iron (II) Ions on Ischemia Modified Albumin.” Turkish J Bio 33 (2008): 31-34.
- Fayez, Safa S, Rashied M Rashied and Shakir FT Al-Alaaraji. “Evaluation of Serum Clusterin Levels in Type 2 Diabetic Men with and Without Cardiovascular Disease.” Iraq J Sci (2020): 978-984.
- Kazi, Tasneem Gul, Hassan Imran Afridi, Naveed Kazi and Mohammad Khan Jamali, et al. “Distribution of Zinc, Copper and Iron in Biological Samples of Pakistani Myocardial Infarction (1st, 2nd and 3rd Heart Attack) Patients and Controls.” Clin Chimica Acta 389 (2008): 114-119.
- Higgins, John P and Johanna A Higgins. “Elevation of Cardiac Troponin I Indicates more than Myocardial Ischemia.” Clin Invest Med 26 (2003): 133-147.
- Tucker, John F, Richard A Collins, Alfred J Anderson, and Jacqueline Hauser, et al. “Early Diagnostic Efficiency of Cardiac Troponin I and Troponin T for Acute Myocardial Infarction.” Acad Emerg Med 4 (1997): 13-21.
- Mythili, Sabesan and Narasimhan Malathi. “Diagnostic Markers of Acute Myocardial Infarction.” Biomed Rep 3 (2015): 743-748.
- Mueller, Christian, Martin Möckel, Evangelos Giannitsis and Kurt Huber, et al. “Use of Copeptin for Rapid Rule-Out of Acute Myocardial Infarction.” Eur Heart J Acute Cardiovasc Care 7 (2018): 570-576.
- Greisenegger, Stefan, Helen C Segal, Annette I Burgess and Debbie L Poole. et al. “Copeptin and Long-Term Risk of Recurrent Vascular Events After Transient Ischemic Attack and Ischemic Stroke: Population-Based Study.” Stroke 46 (2015): 3117-3123.
- Möckel, Martin and Julia Searle. “Copeptin—Marker of Acute Myocardial Infarction.” Curr Atheroscler Rep 16 (2014): 421.
Citation: Al-Obaidi, Sahar FH, and Shakir FT Alaaraji. "The Relationship between Copeptin and Some of the Biomarkers in Iraqi Myocardial Infarction Patients" Clin Schizophr Relat Psychoses 15S (2021). Doi:10.3371/CSRP.ASSA.091721.
Copyright: © 2021 Al-Obaidi SFH, et al. This is an open-access article distributed under the terms of the Creative Commons Attribution License, which permits unrestricted use, distribution, and reproduction in any medium, provided the original author and source are credited. This is an open access article distributed under the terms of the Creative Commons Attribution License, which permits unrestricted use, distribution, and reproduction in any medium, provided the original work is properly cited.


