 ISSN: 1935-1232 (P)


Research Article - Clinical Schizophrenia & Related Psychoses ( 2025) Volume 19, Issue 2
Convolutional Neural Network and Power Spectrum Density Features for Detection and Prediction of Epilepsy
G. Alizadeha*, T. Yousefi Rezaiia and S. MeshginiaG. Alizadeha, Department of Biomedical Engineering, Faculty of Electrical and Computer Engineering, University of Tabriz, Tabriz, Iran, Email: ali.alizadeh@tabrizu.ac.ir
Received: 26-Jun-2024, Manuscript No. CSRP-24-139897; Editor assigned: 28-Jun-2024, Pre QC No. CSRP-24-139897 (PQ); Reviewed: 12-Jul-2024, QC No. CSRP-24-139897; Revised: 03-Mar-2025, Manuscript No. CSRP-24-139897 (R); Published: 10-Mar-2025
Abstract
Epilepsy is a neurological disorder that affects the lives of more than 60 million people worldwide. Timely diagnosis of the onset of epileptic attacks will significantly help people suffering from epileptic seizures. At present, the use of a seizure detection device has not been reported. A neurologist analyzes the brain signal in diagnosis and treatment centers, often associated with human error. In recent years, researchers have done a lot of research to design and build an automatic system for diagnosing and estimating the occurrence of epilepsy. This study proposed a new method based on brain signals and the Convolutional Neural Network (CNN). In this research, Power Spectrum Density (PSD) is used to create features. Several tests were conducted, and the accuracy of the proposed algorithm was 96.9%. The proposed method is more accurate, cheap, simple, and practical than the previous methods. After entering the field of operation, it can be used as a doctor's assistant and as a warning system for the patient.
Keywords
Epilepsy • Electroencephalogram • a Convolutional Neural Network (CNN) • Power Spectrum Density (PSD) • Prediction
Introduction
Epileptic convulsion represents a significant and noteworthy global concern, affecting approximately 1% of the world's population [1]. Individuals afflicted with epilepsy encounter a multitude of challenges in their daily lives. Currently, the primary approaches for managing this condition involve pharmaceutical intervention and, in severe cases, surgical procedures. Regrettably, there is no definitive treatment available for the various forms of epilepsy [2-3]. One of the foremost issues that epilepsy patients face is the sudden onset and unpredictable nature of the condition [4-5]. Given its abrupt initiation and the inability to forecast its occurrence, individuals with epilepsy are more susceptible to vulnerabilities in activities such as driving, sleeping, and other aspects of daily life. This heightened vulnerability can lead to life-threatening consequences such as asphyxia, accidents, and even fatalities [6-7]. The World Health Organization (WHO) recognizes epilepsy as a paramount neurological disorder characterized by convulsive episodes [8]. Although it is challenging to completely prevent the occurrence of convulsions resulting from abnormal discharges in various pyramidal neurons, accurate prediction of epilepsy can significantly empower patients in managing and enhancing their quality of life. Notably, approximately 30% of epilepsy patients do not respond to conventional pharmacological treatments [9]. According to the Neural Surgery Center, approximately 50% of individuals afflicted with epilepsy have undergone surgical intervention as part of their treatment plan. Electroencephalography (EEG) is a cost-effective and straightforward technique compared to Magneto Encephalography (MEG) for studying brain signals. By capturing the variations in electrical potential between electrodes placed at different points on the head, EEG provides valuable insights into brain function, including electric changes across different regions, as well as abnormal discharges or spikes that precede and accompany the onset of epilepsy. The diagnosis and prediction of epilepsy using EEG can be time-consuming and prone to errors. In certain cases, such as determining the preictal period, the task becomes challenging due to the distinct brain signals associated with different types of seizures. Consequently, the development of an intelligent system to aid physicians and patients dealing with epilepsy becomes imperative. The advancement of scientific knowledge and the innovation of intelligent algorithms for the automatic detection of epilepsy hold considerable significance. Despite numerous efforts made to create such a system, it is noteworthy that clinical studies have yet to report on the automatic detection and analysis of convulsive episodes. Brain signals derived from individuals with epilepsy are categorized into ictal, preictal and interictal patterns. Thus, an intelligent epilepsy detection system refers to a system capable of accurately distinguishing between these states in a short amount of time. Various diagnostic algorithms utilizing EEG have been presented by researchers worldwide. These studies have predominantly employed time domain, frequency domain, and time-frequency domain variables to extract EEG features. Some initial systems have utilized EEG voltage thresholds for epilepsy diagnosis. In wavelet-based filters were employed for feature extraction in both the time and frequency domains. The authors claimed that the presented algorithm exhibited higher accuracy and computational load compared to other methods. The extraction of EEG features using the short-time Fourier transform was discussed. In, FFT and SVM were utilized for an epilepsy diagnosis system, which incurred a high computational load. In the extraction of EEG features was followed by classification based on similarity, and subsequently, signals were detected using a classifier. Discrete wavelet was employed for feature extraction in to enhance the accuracy of epilepsy diagnosis. Mathematical relationships were utilized for feature classification, and SVM was employed for the final diagnosis. Another approach proposed in utilized SVM to increase the accuracy of diagnosis, with optimization of SVM parameters using GA. Deep learning techniques were implemented in, where feature extraction was eliminated, and EEG was directly inputted into a deep neural network. In, EEG data from epilepsy patients underwent preprocessing before being applied to a wavelet analyzer. The output of the wavelet analyzer was then used with SVM and KNN classifiers, resulting in an accuracy of 93%. In, a hybrid optimizer model consisting of Principle Component Analysis (PCA), Independent Component Analysis (ICA), and Different Search Algorithm (DSA) was employed for feature extraction after acquiring EEG data from epilepsy patients. Subsequently, a trained CNN and an encoder were utilized for epilepsy diagnosis. In another study conducted in a neurology center, EEG recordings were obtained from 13 patients with epilepsy subsequently, EEG signals are transformed into 2D images of size 256 × 256, which are then combined with the channel information to form 3D images (22 × 256 × 256). Ultimately, a 3D CNN is employed for diagnosis, achieving an accuracy of 90%. In a study conducted at Bonn University, an algorithm based on a 13-layer CNN is reported to have an accuracy of 88.6%. The utilization of CNN for analyzing EEG signals in various patients is explored in through three experiments involving different combinations of classes, namely ictalpreictal, interictal-preictal, and ictal-preictal-interictal. The authors separately employed time and frequency domains in their analysis. Accuracy values of 91.1%, 83.8%, and 85.1% were obtained in the time domain, while accuracy values of 96.7%, 95.4%, and 92.3% were achieved in the frequency domain. To enhance the overall accuracy, particularly when combining data from multiple individuals, the authors utilized Power Spectral Density (PSD), the raw signal itself, a CNN, and an MLP perceptron neural network for the final decision. The performance of these components is further discussed in the subsequent sections.
Materials and Methods
Epilepsy, a prevalent neurological disorder, is characterized by the occurrence of undesired discharges from pyramidal cells within the brain. This condition leads to a loss of consciousness in patients and, in certain instances, manifests as bodily tremors. The challenges posed by epilepsy significantly impact affected individuals. Consequently, researchers from medical, engineering, and cognitive science backgrounds have conducted numerous studies aimed at diagnosing and managing this condition. To identify epilepsy, EEG is performed on individuals who are at risk of developing the disorder, employing a carefully regulated protocol. Illustrates the conventional diagnostic system employed in recent years for epilepsy diagnosis.
Sections of the conventional system
The conventional system consists of several distinct sections, namely data acquisition, segmentation, signal-to-image conversion, and CNN. Subsequently, each of these sections will be described individually.
Data acquisition
In the present section, the brain data acquired consists of either single-channel or 23-channel recordings. In certain instances, a higher number of channels, such as 64 or more, may be employed. These channels are captured using electrodes specifically designed for EEG, typically utilizing Ag-AgCl material. Subsequently, the acquired signals undergo amplification through an amplifier system and are subsequently subjected to a notch filter to effectively eliminate any interference originating from the urban electricity frequency, commonly 50 Hz or 60 Hz.
Segmentation
Upon receiving the desired EEG signals with their noise eliminated, it becomes necessary to segment these signals based on the specified sampling frequency. The designated sampling frequency for segmentation is set at 256 Hz, as it facilitates a suitable equilibrium between signal accuracy and processing speed.
Converting signal to image
Within this section, EEG undergoes a transformation into 2D image data, facilitating its application in CNNs. The conversion process necessitates the construction of an m × n matrix, wherein m denotes the number of channels and n is determined through segmentation procedures. It is worth noting that, depending on the circumstances, n can either match the sampling frequency or deviate from it, either being smaller or larger in value.
CNN
The CNN stands out as a significant deep learning method extensively employed for training multiple layers through a robust technique. This method exhibits remarkable efficiency and represents one of the most prevalent approaches in the realm of computer vision. CNN has found notable applications in diverse domains such as industry and medicine. In particular, its implementation in various robotic systems, the detection of different tumors in medical images, face recognition, and the simulation of various image states have garnered attention. When compared to primary classifiers like MLP, ANN, KNN, and SVM, CNN demonstrates superior capability in extracting features for the analysis of extensive datasets. The principal objective of a CNN revolves around extracting features from images and signals, followed by their classification. Consequently, recent years have witnessed a surge in studies focusing on CNNbased analysis of EEG signals. These studies encompass various aspects, including the prediction of epilepsy, dizziness, and excitation, among others. Consequently, there has been a widespread increase in scientific interest regarding the utilization of CNN for epilepsy prediction. The general architecture of a CNN is depicted.
A typical CNN comprises three primary layers: The convolution layer, the pooling layer, and the fully connected layer. Each layer performs a specific image processing operation. In the convolution layer, a convolution operation is conducted using different-sized differentiation masks or kernels, such as 3 × 3 or 5 × 5, to detect image changes in various directions, resulting in the creation of new images. After convolution, the output of convolving the input image with the selected mask is passed through a Rectified Linear Unit (ReLU) function, which primarily acts as a linear function. The second layer involves down-sampling, which reduces the dimensions of the images generated in the first layer. By considering the outcomes obtained from the first and second layers, classification and detection of the input image are performed in the fully connected layer. In certain studies, when dealing with high-dimensional images and aiming for more detailed features, there is a repetition of the first and second layers. However, an excessive increase in the number of these layers leads to a higher computational load, necessitating a larger dataset for training the network's parameters. In the context of EEG studies, the number of electrodes used to record brain signals directly influences the creation of 2D images. Consequently, the first and second layers cannot be repeated more than three layers since further repetition would diminish the accuracy of the neural network and result in the loss of features at the output layers.
Features
Two crucial parameters in EEG exhibit variations corresponding to an individual's state, encompassing sleep, excitation, fear, awareness, sadness, stress, and epilepsy. Consequently, distinct regions of the brain tissue are activated in accordance with these states, as depicted. Each state entails a unique intensity and frequency spectrum within the EEG. Notably, the amplitude of the signal and frequency spectrum differ between epilepsy and nonepilepsy states. Various mathematical functions have been proposed for extracting these two parameters. Noteworthy functions include Fast Fourier Transform (FFT), Discrete Wavelet Transform (DWT), and Independent Component Analysis-Principal Component Analysis (ICA-PCA).
FFT
EEG is susceptible to detecting any physiological changes in brain tissue, leading to the presence of unwanted discharges before and after an epileptic event. These alterations significantly impact the frequency and amplitude of the brain signal. Therefore, the application of the Fourier Transform emerges as a valuable method for analyzing the frequency spectrum of EEG, allowing it to serve as a distinguishing feature for epilepsy detection and prediction. During the interictal state, the frequency spectrum of brain signals undergoes changes corresponding to the patient's emotional state, encompassing variables such as depression, sadness, happiness, dizziness, and others. However, preceding the occurrence of epilepsy, spikes become evident in the brain signals, instantly modifying the frequency spectrum. Furthermore, during the ictal state, both the frequency and amplitude of the brain signal increase. Consequently, by considering the discrepancies in the frequency spectrum across the ictal, preictal, and interictal states, FFT proves to be a valuable tool for extracting informative features.
DWT
Another well-known technique utilized for feature extraction is the Discrete Wavelet Transform (DWT), which aids in the segregation of distinct frequency ranges, facilitating the identification of the nature and performance of the brain. By employing the DWT, it becomes feasible to calculate various harmonics of an EEG signal. Given that the brain signals during ictal, preictal, and interictal states exhibit dissimilar characteristics, the DWT enables discrimination of these three distinct states by focusing on discrepancies in frequency ranges. During the interictal state, all frequency spectra of the brain, including α, demonstrate normal behavior. However, in the preictal state, transient spike pulses cause momentary alterations in all frequency spectra Δ, θ, γ, and β of the EEG. When entering the ictal state, more pronounced changes in the frequency spectrum become evident, particularly at higher frequencies. Hence, by considering the disparities in frequency spectra between different EEG states, the DWT can serve as a valuable feature for extraction purposes.
ICA-PCA function
An additional method for feature extraction involves the utilization of Principal Component Analysis (PCA) followed by Independent Component Analysis (ICA). Given that EEG signals consist of multiple components α, θ, γ, and β this approach allows for the extraction of five frequency spectra from the EEG by considering the dominant frequency within each area of the brain. It is important to note that each Δ area is also composed of a frequency spectrum, representing the primary component of that specific region. Consequently, through the examination of relevant components and independent components, it becomes possible to discriminate between the three distinct EEG states in patients affected by epilepsy.
The proposed algorithm and system
This study utilizes 23-channel EEG signals, sampled at a frequency of 256 Hz, in conjunction with the PSD of the basic proposed system depicted, to facilitate the diagnosis and prediction of epilepsy. The basic proposed system consists of two components, namely the PSD and a CNN. The system initially receives EEG signals, calculates their PSD, and subsequently applies the resulting two-dimensional (2D) image to the CNN, thereby enabling the extraction of additional image features. Moreover, to enhance the accuracy and reliability of the system, an extended proposed system, as depicted, is presented. In contrast to the proposed system, this extended system employs two parallel paths to extract features from the images derived from both the EEG signals and their corresponding PSD. Notably, the output of the CNN along this path is further processed by a perceptron neural network depicted, aiming to augment the system's accuracy by utilizing the features extracted from the first and second trajectories of the CNN. Specifically, the neural network architecture comprises an input layer with 128 neurons, a hidden layer with 64 neurons, and an output layer with 30 neurons. For the input and output layers, the aforementioned neural network employs 30 neurons each. It is worth mentioning that the systems described above are trained using three distinct methods. The first method corresponds to the conventional approach employed in prior studies, wherein the data of each individual is independently applied to the systems. The remaining two methods, namely identical integration cooperation and non-identical integration cooperation, represent integrated approaches.
In the identical integration cooperation method, the system uniformly employs the same number of existing images from all participants to train the network. Similar to the conventional method, 80% of the images are allocated for training purposes, while the remaining 20% are utilized for testing. On the other hand, the nonidentical integration cooperation method differs from its identical counterpart. In this approach, all images captured from all individuals are gathered in a folder, and a random selection of images, which may not be identical for each participant, is made for the purposes of testing and training. In this case, 80% of the data is designated for training, while the remaining 20% is utilized for testing. To provide a clear overview of the experiments conducted in this paper, which will be subsequently described in detail, a tree diagram depicted is presented. Examining this diagram reveals that the conventional test and train method is applied to both the conventional system and the basic proposed system. Furthermore, the identical and non-identical test and train methods are applied to the conventional system, the basic proposed system, and the extended proposed system. Consequently, a total of eight distinct experiments are performed on all participants, and the results are subsequently extracted.
DATA
This study utilizes two types of databases. The first dataset comprises EEG signals obtained from 16 patients diagnosed with epilepsy, consisting of 7 women and 9 men, ranging in age from 10 to 45 years. These signals were recorded for a duration of 45 minutes at a hospital in Urmia. During the signal recording process, some patients experienced the ictal state. The EEG device utilized for recording the signals is depicted and is manufactured by NIHON KOHDEN. This device is equipped with 23 channels, employing 23 electrodes to convert ion changes into electrical changes. To amplify the signals received from the electrodes, an isolated amplifier is employed in the device. Additionally, a notch filter is utilized to eliminate the 50 Hz noise. Furthermore, a 16-bit ADC is employed to convert and transmit the data to a computer.
The sampling frequency of this system is set at 256Hz. Table 1 provides an overview of the characteristics of the patients who participated in this study. The second database used in this research is the EEG database of the Massachusetts Institute of Technology (MIT) in the United States. The data was downloaded from the CHBMIT website, accessible at http://physionet.org/cgi-bin/atm/ATM, and consists of 16 sets of 23-channel EEG data with a sampling frequency of 256 Hz.
| ID | Sex | Age | Time | Seizure | Start time of seizure | Stop time of seizure |
| 1 | F | 32 | 8:20-9:05 | No | ** | ** |
| 2 | F | 28 | 9:30-10:05 | No | ** | ** |
| 3 | F | 16 | 11:55-11:10 | No | ** | ** |
| 4 | F | 10 | 13:45-13:00 | No | ** | ** |
| 5 | F | 18 | 14:00-14:45 | No | ** | ** |
| 6 | M | 40 | 16:00-15:15 | No | ** | ** |
| 7 | M | 25 | 8:00-8:45 | Yes | 8:20 | 8:22 |
| 8 | F | 14 | 9:10-9:55 | No | ** | ** |
| 9 | F | 22 | 10:05-10:50 | No | ** | ** |
| 10 | F | 36 | 11:10-11:55 | No | ** | ** |
| 11 | M | 46 | 12:20-13:05 | Yes | 12:43 | 12:44 |
| 12 | F | 35 | 13:30-14:15 | No | ** | ** |
| 13 | M | 16 | 14:35-15:20 | Yes | 15:02 | 15:04 |
| 14 | M | 24 | 15:35-16:20 | Yes | 16:12 | 16:13 |
| 15 | F | 6 | 8:30-9:15 | No | ** | ** |
| 16 | F | 15 | 10:10-10:55 | No | ** | ** |
Table 1. Characteristics of the patients participating in this study.
DATA preparation
In order to evaluate and train the CNN utilized in both the basic and extended proposed systems, a dataset consisting of 23-channel EEG signals and their corresponding PSD is employed. To generate images from the EEG signals and their PSD, the received brain signals are divided into sub-signals, as depicted which correspond to different signal states. Subsequently, the PSD of these sub-signals is calculated, as illustrated. Upon careful examination, notable distinctions become apparent among the preictal, interictal, and ictal states. Specifically, when comparing the three states in channel 1, it is evident that the signal oscillations during the ictal state surpass those observed during the preictal state. Conversely, the interictal state exhibits fewer oscillations, indicating a relatively normal signal. Although the preictal state shares similar signal oscillations with the interictal state, sporadic spikes are observed, which lead to alterations in the frequency spectrum and the corresponding PSD. Further scrutiny of the PSDs presented reveals significant disparities in the visual characteristics of the three states. Notably, the transformations in appearance provide strong evidence of distinctive features within the preictal, interictal, and ictal states. It is noteworthy that the constructed images derived from the EEG sub-signals and their PSD are classified into interictal-ictal and interictal-preictal-ictal classes. Each sub-signal and its associated PSD are represented as a 23 × 256 matrix, which is subsequently converted into a 2D image, as exemplified. It should be noted that the MATLAB software command "imagesc (A)" was used throughout this study to display images of the above signals. This command displays the 23 × 256 matrix as a 256 × 256 image. In order to apply these images to the neural network, we resized them to 64 × 64 dimensions. To begin the data processing, the preictal, ictal, and interictal states are initially separated and segmented in the dataset obtained from the participating individuals in the experiments, as well as the CHB-MIT data. By precisely identifying the commencement and termination points of the ictal states, as well as the onset of spike pulses, the subsignals pertaining to the ictal and preictal states can be effortlessly isolated from the main signal. It is important to note that the presence of EEG signal spikes signifies the occurrence of the preictal state. Consequently, utilizing this approach facilitates the straightforward separation of the sub-signals corresponding to the interictal state.
An experimental study was conducted to determine the optimal number of sample images required for training and testing the CNN in the conventional, basic, and extended proposed systems, specifically for the ictal, preictal, and interictal states. Independent experiments were performed using these systems, utilizing 200, 400, 600, and 800 images for the interictal-ictal class, aiming to diagnose epilepsy. Among these experiments, the one employing 600 images was selected due to its high accuracy and efficiency. In other words, a total of 600 images were chosen from the recorded images, representing the interictal, preictal, and ictal states. Consequently, 1800 images were constructed for the three-class state, while 1200 images were utilized for the two-class state. Subsequently, 60 images were randomly selected for each state (interictal, preictal, and ictal) from a pool of images obtained from 10 participating patients. To combine these images, two integration cooperation methods were employed: identical integration cooperation and non-identical integration cooperation. In the identical integration cooperation method, a total of 12 images were selected from each individual to achieve an 80% to 20% ratio for the train and testing datasets. The CNN then extracted features from these 12 images. On the other hand, the non-identical integration cooperation method also maintained an 80% to 20% ratio for the training and test data, with the distinction that the number of images taken from each individual for training was not necessarily the same. Consequently, this method allowed for the training of the system without utilizing images from one or several patients. For further clarity, Provides a visual representation of the image selection process for these two methods.
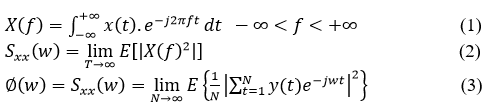
Power spectral density
The PSD holds significant mathematical value as it provides essential insights into the frequency and energy distribution of a signal. By applying the FFT to a signal using Equation (1), the intensity or amplitude of the signal at various frequencies can be calculated. Equation (2) enables the computation of the power of the FFT, resulting in the output of the power spectral density. However, in discrete signals, Equation (3) is commonly employed to calculate the PSD. This equation can be applied directly or as a windowing technique on the signal. Among the methods utilizing the window approach, the Welch method is widely employed. This technique involves dividing a signal into multiple sections, and the PSD of each section is independently calculated. Considering the distinct frequency and amplitude characteristics of EEG signals associated with the ictal, preictal, and interictal states, as depicted, PSD serves as a suitable candidate for selecting pre-features. Furthermore, as illustrated, notable differences can be observed among the interictal, preictal, and ictal states. Particularly in the ictal state, the PSD exhibits higher changes compared ssto the other two states. This can be attributed to the presence of unwanted oscillations in the parmodal cells, which occur at higher frequencies during the ictal state. Additionally, reveals that in the preictal state, unwanted oscillations caused by the discharge of parmodal cells manifest as spikes during the preictal period. These spikes exhibit varying durations, leading to significant alterations in the amplitude and frequency spectrum of the EEG signal.
In this study, a CNN was employed to extract features from the images generated using 23-channel EEG signals and the images obtained from the PSD of the EEG signals. The CNN utilized in this study consists of three layers, and the configuration of the first and second layers with three iterations is depicted. This structure is divided into three parts, each with a convolutional layer and a max pooling layer. In the last part of the architecture, a full connection layer was utilized for the final decision. Moreover, a 3 × 3 mask was used for the convolution of the input images in each of the convolutional layers, and the results of the convolutional classes were then passed through a ReLU function, which benefited from the Arctanh function. At the output of the first part, from the input image with dimensions of 64 × 64, 32 images were produced with dimensions of 64 × 64. Down-sampling operations were performed on the aforementioned images in the following max pooling layer, yielding images with 32 × 32 dimensions. At the output of the second part, from the input image with dimensions of 32 × 32 resulting from the first layer, 64 images with dimensions of 32 × 32 were generated in the convolutional layer. Subsequently, in the max pooling layer, down-sampling operations were performed on the above-stated images, and images with 16 × 16 dimensions were created. In the output of the third part, from the input images with dimensions of 16 × 16 produced in the second layer, 128 images with dimensions of 8 × 8 were produced. Then the output of the CNN is then passed to a Multi- Layer Perceptron (MLP) neural network to make the final decision. To evaluate the diagnostic system, as illustrated, individual testing was performed on data obtained from 16 patients diagnosed with epilepsy, which was downloaded from the CHB-MIT dataset. It should be noted that in these experiments, the train and test ratio was set to 80% and 20% respectively. Furthermore, the number of Epochs was selected as 25, and a stride value of 1 was employed.
Results
To validate the aforementioned features of the proposed systems and methods, a series of experiments were conducted on patient data. The results of these experiments were individually presented to assess the performance of the proposed systems and methods. The experiments focused on the interictal-ictal and interictal-preictal-ictal classes. Various methods, including FFT, DWT, PCA, ICA, and PSD, were employed to evaluate these two classes using the provided dataset. The two-class experiments were conducted using both the conventional system and the basic proposed system, considering all of the aforementioned functions as well as the PSD function. Additionally, to compare the two-class state in the basic proposed system, alternative functions were utilized in place of PSD. Furthermore, three-class experiments were performed using the basic proposed system with any of the mentioned functions. It is important to note that these experiments were conducted on data obtained from the patients who participated in the sampling process, as well as data acquired from the CHB-MIT dataset. The results obtained from these experiments are presented in Tables 2-5 categorized based on the employed function and dataset used for analysis.
|
|
Interictal-ictal in conventional system |
Interictal-ictal in basic proposed system-PSD |
Interictal-preictal-ictal in conventional system |
Interictal-preictal-ictal in basic proposed system-PSD |
||||
|
Patient ID |
acc |
sen |
spe |
acc |
sen |
spe |
acc |
acc |
|
1 |
0.583 |
0.615 |
0.545 |
0.951 |
0.955 |
0.947 |
0.541 |
0.932 |
|
2 |
0.666 |
0.625 |
0.714 |
0.968 |
0.975 |
0.952 |
0.623 |
0.949 |
|
3 |
0.616 |
0.666 |
0.566 |
1 |
1 |
1 |
0.564 |
0.972 |
|
4 |
0.725 |
0.789 |
0.613 |
0.963 |
0.975 |
0.936 |
0.672 |
0.946 |
|
5 |
0.658 |
0.714 |
0.609 |
0.976 |
0.982 |
0.963 |
0.612 |
0.956 |
|
6 |
0.65 |
0.645 |
0.655 |
0.956 |
0.975 |
0.915 |
0.61 |
0.934 |
|
7 |
0.583 |
0.666 |
0.75 |
0.956 |
0.961 |
0.945 |
0.547 |
0.936 |
|
8 |
0.583 |
0.615 |
0.545 |
0.948 |
0.937 |
0.96 |
0.548 |
0.921 |
|
9 |
0.691 |
0.75 |
0.575 |
1 |
1 |
1 |
0.654 |
0.978 |
|
10 |
0.658 |
0.666 |
0.65 |
0.946 |
0.952 |
0.933 |
0.616 |
0.918 |
|
11 |
0.641 |
0.666 |
0.616 |
0.986 |
0.99 |
0.979 |
0.564 |
0.967 |
|
12 |
0.725 |
0.696 |
0.722 |
0.971 |
0.975 |
0.963 |
0.672 |
0.956 |
|
13 |
0.716 |
0.718 |
0.714 |
0.961 |
0.97 |
0.936 |
0.682 |
0.936 |
|
14 |
0.691 |
0.682 |
0.701 |
0.971 |
0.975 |
0.963 |
0.657 |
0.948 |
|
15 |
0.616 |
0.606 |
0.629 |
1 |
1 |
1 |
0.573 |
0.981 |
|
16 |
0.583 |
0.615 |
0.545 |
0.961 |
0.982 |
0.912 |
0.547 |
0.938 |
|
Average |
0.649 |
0.670 |
0.634 |
0.969 |
0.975 |
0.956 |
0.605 |
0.948 |
Table 2. Results of the two-class and three-class experiments on the data recorded from the individuals participating in the sampling with the conventional and the basic proposed system using PSD.
| Interictal-ictal in conventional system | Interictal-ictal in basic proposed system-PSD | Interictal-preictal-ictal in conventional system | Interictal-preictal-ictal in basic proposed system-PSD | |||||
| Patient ID | acc | sen | spe | acc | sen | spe | acc | acc |
| 1 | 0.72 | 0.781 | 0.611 | 1 | 1 | 1 | 0.691 | 0.983 |
| 2 | 0.69 | 0.697 | 0.682 | 1 | 1 | 1 | 0.683 | 0.982 |
| 3 | 0.658 | 0.66 | 0.656 | 0.978 | 0.987 | 0.958 | 0.651 | 0.971 |
| 4 | 0.666 | 0.687 | 0.642 | 0.991 | 0.955 | 0.984 | 0.659 | 0.981 |
| 5 | 0.623 | 0.645 | 0.6 | 0.951 | 0.954 | 0.944 | 0.617 | 0.942 |
| 6 | 0.615 | 0.632 | 0.595 | 0.941 | 0.952 | 0.916 | 0.61 | 0.937 |
| 7 | 0.643 | 0.666 | 0.62 | 0.968 | 0.975 | 0.952 | 0.637 | 0.959 |
| 8 | 0.696 | 0.707 | 0.684 | 1 | 1 | 1 | 0.658 | 0.981 |
| 9 | 0.633 | 0.625 | 0.642 | 0.955 | 0.975 | 0.91 | 0.631 | 0.943 |
| 10 | 0.646 | 0.641 | 0.652 | 0.971 | 0.975 | 0.963 | 0.637 | 0.967 |
| 11 | 0.653 | 0.649 | 0.657 | 0.98 | 0.985 | 0.969 | 0.642 | 0.976 |
| 12 | 0.661 | 0.66 | 0.663 | 0.983 | 0.987 | 0.974 | 0.659 | 0.978 |
| 13 | 0.636 | 0.628 | 0.645 | 0.966 | 0.975 | 0.947 | 0.628 | 0.956 |
| 14 | 0.648 | 0.643 | 0.653 | 0.973 | 0.98 | 0.958 | 0.638 | 0.962 |
| 15 | 0.625 | 0.615 | 0.636 | 0.953 | 0.956 | 0.945 | 0.618 | 0.947 |
| 16 | 0.62 | 0.609 | 0.632 | 0.984 | 0.963 | 0.913 | 0.618 | 0.938 |
| Average | 0.652 | 0.659 | 0.641 | 0.972 | 0.978 | 0.958 | 0.644 | 0.962 |
Table 3. Results of the two-class and three-class experiments on the data taken from CHB-MIT with the conventional and the basic proposed system using PSD.
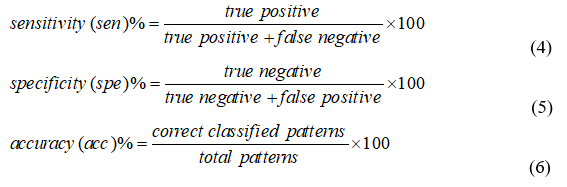
Upon careful examination of the presented tables, it becomes apparent that within the two-class state, the accuracy, sensitivity, and specificity values for both the conventional system and the basic proposed system can be derived by employing the following equations.
Upon analysis of Table 2, it becomes evident that the accuracy of the conventional system exceeds 0.583, with a mean accuracy of 0.649 across all participants. Furthermore, the accuracy of the basic proposed system for the two-class state reaches 0.946, with a mean accuracy of 0.969. Evaluating the results obtained from the participants in the two-class states, it is discernible that the conventional system and the basic proposed system exhibit optimal performance in the cases of patients 3, 9, and 15, while patient 10 represents the worst outcome. Table 3 also presents the results for the three-class state in both the conventional and basic proposed systems, focusing solely on system accuracy. The outcomes indicate that the mean accuracy of the conventional system in the three-class state amounts to 0.605, with a minimum accuracy of 0.541. On the other hand, the basic proposed system achieves a minimum accuracy not lower than 0.921, and its mean accuracy reaches 0.948 in the three-class state. To further analyze the experimental results for the two-class and three-class states in the conventional and basic proposed systems, Table 4 is provided, utilizing data recorded from the individuals participating. The presented outcomes in this table underscore the notion that more favorable accuracy results can be attained when the signals are recorded under ideal conditions. In order to compare the performance of the basic proposed system with other functions, Tables 5 showcase the results obtained by applying FFT-DWT-PCA-ICA to the acquired data and the data from CHB-MIT, respectively. A comparison between the results presented in Tables 3 and 5 reveals that the mean accuracy for PCA-ICA, DWT, FFT, and PSD stands at 0.969, 0.946, 0.912, and 0.812, respectively. Moreover, when assessing the experiments conducted in the three-class state, it is evident that the application of the PSD function yields a mean accuracy of 0.972, surpassing the performance of all other functions. This comparison is consistent with Tables 2 and 4, where the utilization of PSD on various spectrums demonstrates superior outcomes compared to other functions. The results presented in Tables 2 and 3 pertain to the two-class and three-class states and were obtained through the utilization of the conventional method. It is important to note that these results are specific to individual indices. Consequently, in the event of developing a diagnostic and predictive device, the data would need to be retrained for each individual. To address this limitation and establish a universal and comprehensive system capable of accommodating all epilepsy patients without necessitating individual retraining, another experiment was conducted using the data obtained from the participants and the data obtained from CHB-MIT, employing both identical and non-identical integration cooperation methods. The outcomes of these experiments are depicted. In this scenario, the accuracy of the basic proposed system employing identical and non-identical integration cooperation methods amounts to 92% and 90%, respectively, while the accuracy of the extended proposed system employing identical and nonidentical integration cooperation methods reaches 95.6% and 94%, respectively. It is noteworthy that the application of identical and nonidentical integration cooperation methods on the data derived from CHB-MIT, utilizing the basic proposed system, yields an accuracy of 0.962 and 0.951, respectively, whereas the extended proposed system achieves an accuracy of 0.978 and 0.988 under the same conditions.
| Interictal-ictal in basic proposed system-FFT | Interictal-ictal in basic proposed system-DWT | Interictal-ictal in basic proposed system-PCA-ICA | Interictal-preictal-ictal in basic proposed system-FFT |
Interictal-preictal-ictal in basic proposed system-DWT | Interictal-preictal-ictal in basic proposed system-PCA-ICA | |||||||
| Patient ID | acc | sen | spe | acc | sen | spe | acc | sen | spe | acc | acc | acc |
| 1 | 0.951 | 0.955 | 0.947 | 0.92 | 0.93 | 0.894 | 0.824 | 0.833 | 0.795 | 0.933 | 0.893 | 0.8 |
| 2 | 0.943 | 0.955 | 0.93 | 0.905 | 0.92 | 0.841 | 0.816 | 0.81 | 0.826 | 0.941 | 0.88 | 0.791 |
| 3 | 0.948 | 0.937 | 0.96 | 0.911 | 0.945 | 0.83 | 0.816 | 0.821 | 0.808 | 0.937 | 0.911 | 0.792 |
| 4 | 0.926 | 0.955 | 0.895 | 0.888 | 0.909 | 0.831 | 0.8 | 0.81 | 0.818 | 0.915 | 0.871 | 0.78 |
| 5 | 0.968 | 0.975 | 0.952 | 0.931 | 0.952 | 0.883 | 0.843 | 0.833 | 0.858 | 0.972 | 0.927 | 0.825 |
| 6 | 0.963 | 0.975 | 0.936 | 0.928 | 0.952 | 0.872 | 0.841 | 0.833 | 0.854 | 0.958 | 0.932 | 0.822 |
| 7 | 0.946 | 0.952 | 0.933 | 0.91 | 0.952 | 0.811 | 0.816 | 0.81 | 0.863 | 0.951 | 0.901 | 0.802 |
| 8 | 0.945 | 0.968 | 0.893 | 0.908 | 0.919 | 0.879 | 0.816 | 0.821 | 0.808 | 0.92 | 0.887 | 0.803 |
| 9 | 0.931 | 0.95 | 0.888 | 0.895 | 0.909 | 0.856 | 0.81 | 0.824 | 0.788 | 0.93 | 0.865 | 0.792 |
| 10 | 0.938 | 0.952 | 0.905 | 0.901 | 0.93 | 0.829 | 0.81 | 0.81 | 0.808 | 0.925 | 0.883 | 0.788 |
| 11 | 0.976 | 0.982 | 0.963 | 0.933 | 0.952 | 0.888 | 0.885 | 0.882 | 0.888 | 0.965 | 0.922 | 0.821 |
| 12 | 0.956 | 0.975 | 0.915 | 0.918 | 0.952 | 0.838 | 0.82 | 0.837 | 0.768 | 0.952 | 0.892 | 0.814 |
| 13 | 0.956 | 0.961 | 0.945 | 0.92 | 0.934 | 0.883 | 0.82 | 0.81 | 0.768 | 0.95 | 0.923 | 0.807 |
| 14 | 0.965 | 0.985 | 0.922 | 0.928 | 0.93 | 0.923 | 0.82 | 0.857 | 0.768 | 0.943 | 0.938 | 0.795 |
| 15 | 0.94 | 0.947 | 0.921 | 0.905 | 0.93 | 0.841 | 0.81 | 0.824 | 0.788 | 0.941 | 0.885 | 0.783 |
| 16 | 0.938 | 0.968 | 0.881 | 0.9 | 0.919 | 0.848 | 0.81 | 0.802 | 0.823 | 0.935 | 0.887 | 0.785 |
| Average | 0.949 | 0.962 | 0.924 | 0.912 | 0.873 | 0.859 | 0.822 | 0.826 | 0.814 | 0.941 | 0.899 | 0.8 |
Table 4. Results of the two-class and three-class experiments on the data recorded from the individuals participating in the sampling with the basic proposed system using FFT-DWT-PCA-ICA.
| Interictal-ictal in basic Proposed system-FFT | Interictal-ictal in basic proposed system-DWT | Interictal-ictal in basic proposed system-PCA-ICA | Interictal-preictal-ictal in basic proposed system-FFT | Interictal-preictal-ictal in basic proposed system-DWT | Interictal-preictal-ictal in basic proposed system-PCA-ICA | |||||||
| Patient ID | acc | sen | spe | acc | sen | spe | acc | sen | spe | acc | acc | acc |
| 1 | 0.983 | 0.987 | 0.974 | 0.94 | 0.952 | 0.911 | 0.891 | 0.917 | 0.851 | 0.972 | 0.932 | 0.873 |
| 2 | 0.975 | 0.98 | 0.963 | 0.933 | 0.937 | 0.928 | 0.888 | 0.904 | 0.862 | 0.964 | 0.926 | 0.867 |
| 3 | 0.966 | 0.975 | 0.947 | 0.931 | 0.937 | 0.925 | 0.883 | 0.905 | 0.851 | 0.951 | 0.924 | 0.863 |
| 4 | 1 | 1 | 1 | 0.941 | 0.953 | 0.928 | 0.893 | 0.918 | 0.854 | 0.982 | 0.932 | 0.872 |
| 5 | 0.966 | 0.963 | 0.972 | 0.931 | 0.937 | 0.925 | 0.82 | 0.857 | 0.768 | 0.954 | 0.925 | 0.817 |
| 6 | 0.925 | 0.952 | 0.861 | 0.888 | 0.917 | 0.885 | 0.8 | 0.821 | 0.765 | 0.913 | 0.881 | 0.794 |
| 7 | 0.933 | 0.942 | 0.914 | 0.916 | 0.914 | 0.909 | 0.81 | 0.857 | 0.744 | 0.925 | 0.908 | 0.808 |
| 8 | 0.916 | 0.952 | 0.833 | 0.853 | 0.872 | 0.828 | 0.781 | 0.821 | 0.744 | 0.91 | 0.851 | 0.764 |
| 9 | 0.916 | 0.919 | 0.909 | 0.858 | 0.869 | 0.843 | 0.783 | 0.8 | 0.755 | 0.897 | 0.852 | 0.772 |
| 10 | 0.975 | 0.987 | 0.948 | 0.933 | 0.947 | 0.909 | 0.883 | 0.903 | 0.847 | 0.963 | 0.928 | 0.874 |
| 11 | 0.966 | 0.963 | 0.972 | 0.931 | 0.947 | 0.904 | 0.885 | 0.906 | 0.851 | 0.952 | 0.925 | 0.876 |
| 12 | 0.966 | 0.989 | 0.896 | 0.93 | 0.937 | 0.928 | 0.886 | 0.907 | 0.854 | 0.957 | 0.923 | 0.876 |
| 13 | 0.925 | 0.947 | 0.875 | 0.888 | 0.909 | 0.862 | 0.8 | 0.833 | 0.75 | 0.912 | 0.843 | 0.787 |
| 14 | 0.925 | 0.928 | 0.909 | 0.888 | 0.896 | 0.914 | 0.793 | 0.828 | 0.75 | 0.917 | 0.816 | 0.783 |
| 15 | 0.933 | 0.963 | 0.864 | 0.901 | 0.909 | 0.829 | 0.808 | 0.845 | 0.755 | 0.923 | 0.876 | 0.793 |
| 16 | 0.916 | 0.93 | 0.882 | 0.853 | 0.876 | 0.819 | 0.783 | 0.821 | 0.723 | 0.904 | 0.826 | 0.772 |
| Average | 0.949 | 0.961 | 0.919 | 0.913 | 0.919 | 0.89 | 0.836 | 0.865 | 0.795 | 0.937 | 0.889 | 0.824 |
Table 5. Results of the two-class and three-class experiments on the data taken from CHB-MIT with the conventional and the basic proposed system using FFT-DWT-PCA-ICA.
Discussion
The basic proposed system is depicted. It is evident from the figure that the inclusion of PSD enhances the accuracy of the system even when the conventional system is employed. To further enhance the performance of the basic proposed system, an extended proposed system is introduced, which integrates the conventional system and the basic proposed system, as illustrated. Notable advantages of this system include heightened reliability and superior accuracy compared to both the conventional system and the proposed system. To analyze the data in the proposed systems and the conventional system, various tests and training methods are applied.
One such method is the conventional approach, wherein the test and train phases of the CNN are considered independent for each individual, with a train-to- test ratio of 80% to 20%. The second method applied to both the proposed systems and the conventional system is the identical integration cooperation method. This method employs data identically for the test and train phases of the CNN in both the proposed systems and the conventional system. Furthermore, a non-identical cooperation method is proposed, wherein image data from participants classified into three distinct classes are non-identically utilized for the test and train phases of the CNNs. The key feature of the proposed identical and non-identical integration cooperation methods is their ability to provide epilepsy diagnosis and prediction systems for all patients. In other words, the diagnostic device is not limited to a specific individual, thus reducing additional costs associated with designing and constructing individual devices. Notably, the identical integration cooperation method exhibits greater extensibility for public implementation, enabling the evaluation of data from individuals beyond the sampling pool. By applying the integration methods to the proposed systems and the conventional system and analyzing the results, it is evident that the accuracy of the extended and basic proposed systems surpasses that of the conventional system. Consequently, these systems find applicability in various domains, including clinical applications and medical diagnostic devices. Presents a comparative analysis of the results obtained from the proposed systems and the conventional system, utilizing bar diagrams. Upon examination of the figure, it is apparent that, under the same conditions, the accuracy of the extended, basic, and conventional systems employing the identical integration cooperation method is 95.6%, 92%, and 50%, respectively. The non-identical integration cooperation method yields slightly lower results compared to the identical method.
Conclusion
This paper presents a comprehensive study on the diagnosis, prediction, and analysis of EEG signals in the ictal state. Two proposed systems, namely the basic and extended systems, are introduced for this purpose. Additionally, two novel test and train methods, referred to as identical and non-identical integration cooperation methods, are proposed to establish a robust epilepsy diagnosis and prediction system. The experiments are conducted on a cohort of 16 patients diagnosed with epilepsy. To ensure efficiency and accuracy, 600 images are selected for the experimental procedures. Initially, the different signal states are investigated by applying the conventional method to both the conventional system and the basic proposed system. The results demonstrate that the basic proposed system significantly enhances the system's accuracy, leading to a 2% improvement. Moreover, a comprehensive comparison is performed to evaluate the performance of the proposed system using various functions. The findings reveal that the application of PSD yields superior results compared to FFT, DWT, and PCA-ICA. Notably, even in the worst-case scenario, the system utilizing PSD achieves approximately 2% higher accuracy than the system employing FFT. Following the analysis of the conventional method's results, the two proposed methods are applied to the conventional, basic, and extended proposed systems. The outcomes demonstrate that both the basic and extended proposed systems outperform the conventional system. Furthermore, the application of the identical and non-identical integration cooperation methods on the proposed systems yields improved results compared to the conventional system. Specifically, the accuracy of the conventional system using the identical and non-identical integration cooperation methods is measured at 50% and 47%, respectively. Under the same conditions, the application of these two proposed methods to the basic proposed system achieves an accuracy of 92% for the identical integration cooperation method and 90% for the non-identical integration cooperation method. Additionally, the extended proposed system achieves an accuracy of 95.6% when utilizing the identical integration cooperation method and 94% when employing the nonidentical integration cooperation method. These results highlight the efficacy of the proposed systems in improving the overall accuracy of the diagnostic system. Consequently, they can be effectively employed to minimize errors and associated costs in the production of medical devices. It is worth mentioning that a key feature of implementing cooperation methods in the systems is the provision of epilepsy diagnosis and prediction devices for all patients. This approach involves training the device initially using the recorded data, allowing subsequent public use without the need for additional training.
Declaration of Competing Interests
The authors declare that they have no known competing financial interests or personal relationships that could have appeared to influence the work reported in this paper. The authors declare the following financial interests/personal relationships which may be considered as potential competing interests.
References
- Subasi, Abdulhamit, and M. Ismail Gursoy. "EEG signal classification using PCA, ICA, LDA and support vector machines." Expert Syst Appl 37 (2010): 8659-8666.
- Yan, Tianyi, Yansong Geng, Jinglong Wu, and Chunlin Li. "Interactions between multisensory inputs with voluntary spatial attention: An fMRI study." Neuroreport 26 (2015): 605-612.
[Crossref] [Google Scholar] [PubMed]
- Mormann, Florian, Ralph G. Andrzejak, Christian E. Elger, and Klaus Lehnertz. "Seizure prediction: The long and winding road." Brain 130 (2007): 314-333.
[Crossref] [Google Scholar] [PubMed]
- Schulzeâ?Bonhage, Andreas, and Anne Kühn. "Unpredictability of seizures and the burden of epilepsy." Seizure prediction in epilepsy: From basic mechanisms to clinical applications (2008): 1-10.
- Yan, Tianyi, Shuo Zhao, Shota Uono, Xiaoshan Bi, et al. "Target object moderation of attentional orienting by gazes or arrows." Atten Percept Psychophys 78 (2016): 2373-2382.
[Crossref] [Google Scholar] [PubMed]
- Mutlu, Ali Yener. "Detection of epileptic dysfunctions in EEG signals using Hilbert vibration decomposition." Biomed Signal Process Control 40 (2018): 33-40.
- Ahmadi, Amirmasoud, Mahsa Behroozi, Vahid Shalchyan, and Mohammad Reza Daliri. "Classification of epileptic EEG signals by wavelet based CFC." In 2018 Electric Electronics, Computer Science, Biomedical Engineerings' Meeting (EBBT), pp. 1-4. IEEE, 2018.
- Kwan, Patrick, and Martin J. Brodie. "Early identification of refractory epilepsy." New N Engl J Med 342 (2000): 314-319.
[Crossref] [Google Scholar] [PubMed]
- de Tisi, Jane, Gail S. Bell, Janet L. Peacock, and Andrew W. McEvoy, et al. "The long-term outcome of adult epilepsy surgery, patterns of seizure remission, and relapse: a cohort study." Lancet 378 (2011): 1388-1395.
[Crossref] [Google Scholar] [PubMed]
Citation: G. Alizadeha, T. Yousefi Rezaiia and S. Meshginia. "Convolutional Neural Network and Power Spectrum Density Features for Detection and Prediction of Epilepsy." Clin Schizophr Relat Psychoses 19 (2025).
Copyright: © 2025 Alizadeha G, et al. This is an open-access article distributed under the terms of the creative commons attribution license which permits unrestricted use, distribution and reproduction in any medium, provided the original author and source are credited. This is an open access article distributed under the terms of the Creative Commons Attribution License, which permits unrestricted use, distribution, and reproduction in any medium, provided the original work is properly cited.