 ISSN: 1935-1232 (P)


Research Article - Clinical Schizophrenia & Related Psychoses ( 2022) Volume 16, Issue 2
Atypical Functional Connectivity of Limbic Network in Attention Deficit/Hyperactivity Disorder
Charles O. Nyatega1,4*, Li Qiang2, Mohammed A. Jajere2 and Halima Bello Kawuwa32Department of Microelectronics, Tianjin University, Tianjin, China
3Department of Biomedical Engineering, Tianjin University, Tianjin, China
4Department of Electronics and Telecommunication Engineering, Mbeya University of Science and Technology, Mbeya, Tanzania
Charles O. Nyatega, Department of Electrical and Information Engineering, Tianjin University, Tianjin, China, Email: ncharlz@tju.edu.cn
Received: 29-Apr-2022, Manuscript No. CSRP-22-62138; Editor assigned: 02-May-2022, Pre QC No. CSRP-22-62138 (PQ); Reviewed: 16-May-2022, QC No. CSRP-22-62138; Revised: 23-May-2022, Manuscript No. CSRP-22-62138 (R); Published: 31-May-2022, DOI: 10.3371/CSRP.NCLQ.053122
Abstract
Objective: Previous neuroimaging works have been used to research abnormal functional connectivity in patients with Attention Deficit/Hyperactivity Disorder (ADHD). Although most of these studies relied on static functional connectivity, we instead attempt to explore dynamic functional connectivity changes associated with the limbic network connectivity in ADHD.
Methods: We applied sliding window approach to the resting-state functional magnetic resonance imaging data of 25 children with ADHD and 23 Typically- Developing Controls (TD) to generate temporal correlations maps, then we evaluated the average and variability of the limbic structures to the whole brain network functional connectivity in each window.
Results: In ADHD compared to TD during eight minutes and twenty two seconds of scanning time, dynamic resting-state analyses revealed increased average of limbic network connectivity in three different seconds of the seventh minute (i.e fourth, sixth and eighth) and increased variability within all temporal windows in the fifth minute 22 seconds to 32 seconds and between fifth minute 38th second to sixth minute 14th second. ADHD group also reported stronger correlation (r=0.62, p<0.001) between in-scanner head motion and ages compared to the TD group (r=-0.1, p<0.001). Moreover, static functional connectivity (long-range) did not reveal significant differences between the groups.
Conclusion: Our findings suggest that dynamic functional connectivity analyses might be crucial in characterizing abnormal patterns in ADHD and that the exploitation of these dynamics in further investigations may serve as potential indicators of ADHD.
Keywords
Attention deficit/hyperactivity disorder • Functional Magnetic Resonance Imaging (FMRI) • Static functional connectivity • Dynamic functional connectivity • Limbic network
Introduction
Attention Deficit/Hyperactivity Disorder (ADHD) is a neurodevelopmental disorder commonly diagnosed in childhood and sometimes lasts into adulthood [1]. It is believed that two-thirds of children diagnosed with ADHD in early childhood continue to have persistent, impairing symptoms in adulthood [2], characterized by developmentally inappropriate symptoms of excessive inattention, impulsivity and hyperactivity. The inattention component of ADHD is manifested as daydreaming, distractibility, and difficulty focusing on a single task for a prolonged period [3], the impulsivity component is manifested as making hasty actions that occur in the moment without first thinking about them and that may have a high potential for harm, or a desire for immediate rewards or inability to delay gratification [4] while the hyperactivity component is expressed as fidgeting, excessive talking, and restlessness [3], with other study suggests that symptoms of inattention are more likely to persist into adulthood than symptoms of hyperactivity or impulsivity [5], resulting in significant long-term educational and social disadvantage [6]. Various functional neuroimaging studies have been carried out to discover the pathologies underlying ADHD. Intermingling proof has implicated fronto-striatal network anomalies as the core deficits of ADHD [7,8]. Blood Oxygen Level Dependent (BOLD) Functional MRI (fMRI) technique has been used to analyze the ADHD pathology in task- based fMRI study where it measures the mismatch between blood flow and oxygen extraction when neuronal activity occurs [9]. To date, most BOLD fMRI studies on ADHD are task-based [10-13]. That is, they analyzed ADHD pathologies by evaluating the brain activity pattern differences between the ADHD group and their matched controls in certain cognitive tasks [14]. But the results have been inconsistent, for example, one study found hypofrontality in ADHD [11], but another study indicated hyperfrontality [13]. Such discrepancy could be due to different tasks, ages and comorbidity in these studies, also different baseline-activity level may also contribute to the inconsistency among task-specific fMRI studies [15]. As compared to task-based fMRI studies, studies carried out during resting-state are easy to perform (without experiment designing and subject training) and comparable across different studies [16]. Biswal and colleagues using first functional connectivity analysis discovered that low-frequency fluctuation (LFFs, 0.01 Hz to 0.08 Hz) was highly synchronous among motor cortices and concluded that low-frequency fluctuation of blood flow and oxygenation was indeed a neurophysiological index [17]. Some research groups also have used the freely available ADHD-200 sample, consisting of resting state fMRI data of 285 children and adolescents with ADHD and 491 healthy age-matched controls [18] to address differences in functional connectivity in categorical and dimensional analyses [19-22].
Our primary interest lies in understanding the role of thalamus, the amygdala, and the hippocampus during the course of ADHD. These three regions are part of the brain structure known as the limbic network. The limbic network is a collection of brain centers that influence arousal, motivation and learning. The amygdala is responsible for determining which memories, and where the memories are stored in the brain as well as handling the stress within the body. The hippocampus sends memories out to the appropriate part of the cerebral hemisphere for long-term storage and retrieves them when necessary. Damage to this area of the brain may result in an inability to form new memories [23]. The thalamus is involved in sensory perception and regulation of motor functions such as movement. It can be observed that ADHD altered behaviors can be linked with limbic network processes, a deficiency in this region might result in restlessness, inattention, or emotional volatility [24], thus understanding dynamic changes in limbic network functional connectivity might provide insights underlying mechanisms of ADHD.
In this paper, we aimed to investigate ADHD linked with limbic network based on average and temporal variability of dynamic functional connectivity. To achieve these goals, sample data of children with ADHD and Typically-Developing Controls (TD) were obtained from the ADHD-200 Sample of Neuroimage group. The diagnostic model was based on sliding windows on resting-state fMRI data to construct dynamic correlation maps and lastly group differences between ADHD (25 participants) and Typically- Developing Controls (23 participants) were evaluated.
Materials and Methods
Participants
Original fMRI data of participants were obtained from open-access dataset of Neuroimage sample, Neuroimage.001.001.tar.gz release, downloaded from the ADHD-200 Sample [25]. Participants in this study were of 25 ADHD group (ADHD; five females and twenty males, 16.69 years ± 2.91 years of age) and 23 Typically-Developing Controls (TD; twelve females and eleven males, 17.33 years ± 2.57 years of age). All participants were between ages of 11.66 and 20.89, 42 right handed, five left handed and one subject unknown (Table 1).
| Gender | Clinical characteristics | Variables |
|---|---|---|
| Age | Mean ± standard deviation (range) | 16.99 ± 2.74 years |
| ADHD/TD (25/23) | 16.69 ± 2.91 /17.33 ± 2.57 years | |
| Gender | Female (ADHD/TD) | 5/12 |
| Male (ADHD/TD) | 20/11 | |
| ADHD subtype | Combined | 18 (72%) |
| Inattentive | 1 (4%) | |
| Hyperactive/Impulsive | 6 (24%) | |
| Handedness | Right (ADHD/TD) | 21/21 |
| Left (ADHD/TD) | 3/2 | |
| n/a* | 1 | |
| Note: *No available information for this subject. | ||
Resting state fMRI data
All MRI data were obtained on a SIEMENS MAGNETOM Avanto syngo MR B17 scanner. The resting-state functional MRI data (T2*) were recorded with the following parameters: repetition time (TR)=1.96s, slice thickness=3.5 mm, 37 axial slices, data matrix=64 × 64 and 261 volumes. A T1-weighted high-resolution anatomical scan (MPRAGE) were collected with the following parameter: slice thickness=1 mm, slices per slab=176, TR=2730 ms, echo time (TE)=2.95 ms, matrix=256 × 256, Field of View (FoV) read=256 mm, FoV phase=100.0%.
Resting state: One resting-state fMRI scan. Participants were asked to think of nothing in particular while keeping their eyes closed. No visual stimulus was presented during the scan.
Data preprocessing
Resting state fMRI data were preprocessed by Data Processing and Analysis for Brain Imaging (DPABI V5.0, http://rfmri.org/) (Yan, Wang, Zuo, and Zang), an open-source package based on Statistical Parametric Mapping (SPM12, https://www.fil.ion.ucl.ac.uk/spm/) and MATLAB (MATLAB and Statistics Toolbox Release 2018b, The Mathworks, Inc., Natick, Massachusetts, United States). The steps for data preprocessing were as follows: (a) for each subject the first ten volumes were discarded to allow for MR signal equilibrium, leaving 251 volumes for further analyses; (b) correcting slice-timing and realigning images, in which six subjects were discarded for having different slice number (35 instead of 37) in order to maintain consistency; (c) reorientation of the structural and functional images were done manually; (d) co-registering T1 images were segmented into gray matter, white matter, and cerebrospinal fluid on the basis of transformation parameters that indicated transformation from subject native space into the standard Montreal Neurological Institute (MNI) space; (e) nuisance covariates were regressed (including Friston 24 head motion parameters [26] global signal, white matter signal, and cerebrospinal fluid signal), were subjected to additional regression to control for physiological noise; (f) Normalizing functional images to MNI space by Diffeomorphic Anatomical Registration Through Exponentiated Lie algebra (DARTEL) method and reslicing to 3.0 mm3 × 3.0 mm3 × 3.0 mm3 [27]; (g) the normalized images were spatially smoothed using an isotropic Gaussian kernel of 6 mm Full-Width-at-Half-Maximum (FWHM); (h) band-pass filtering at the range of 0.01Hz to 0.08Hz to reduce the effects of low-frequency signals and high-frequency aliasing after data normalization; (i) image volumes with Framewise Displacement (FD)>0.2 mm were scrubbed to reduce the effect of head motion using cubic spline interpolation [28,29] and (j) No fMRI data with maximum head motion were excluded.
Regions of interest selection and static functional connectivity network analysis
In order to identify differences in resting state functional connectivity between ADHD and TD groups, we applied regions from the Automated Anatomical Labeling Template (AAL) [30] to calculate the functional connectivity based on Region of Interest (ROI) analysis, the 90 ROIs of AAL (except, cerebellum) by dividing them into six main regions (including prefrontal regions, other regions of frontal lobe, parietal regions, occipital regions, temporal regions, and subcortical regions according to prior studies [31]. We chose thalamus, the amygdala and the hippocampus (Figure 1) of the limbic network as our primary Region Of Interest (ROI). Lastly we extracted the average time courses from 90 ROIs in order to calculate functional connectivity.

Figure 1. Schematic of the selected ROI defined using the Brain Net Viewer. Note:
( ) Hippocampus; (
 ) Thalamus; (
 ) Amygdala
For the construction of the traditional static resting state functional connectivity network of the brain, we estimated Fisher’s z-transformed Pearson’s correlations coefficients between each pair of the averaged time course in 90 ROIs, to improve the normality of correlation distribution which is over a full range of 251-image volumes [31,32].
Dynamic resting state functional connectivity analysis
For the construction of dynamic resting state functional connectivity analysis network, we used the sliding window method [33]. The window size was established at 30 TRs (60s) because 30s to 60s has been considered reasonable and was used in previous studies [33,34]. An acceptable temporal trade-off between the real dynamic fluctuation and the reliable temporal information has been reached by this range [35]. We selected a sliding temporal window length of 30 TRs (60s) to 251 data length (502s), rectangular sliding windows unconvolved with Gaussian kernel was then used to capture more sharp transitions that could be undetected in tapered windows [36]. By sliding the window by the 2-sec step size 1TR, 222 temporal windows (251-30+1) were generated. Finally, 222 Fisher’s z-transformed Pearson’s correlation maps (90 × 90 matrix size, for each window) for each subject were obtained which were the dynamic resting state functional connectivity maps.
Dynamic resting state functional connectivity characteristic metrics
Since it is a time-varying process, we employed two common metrics to describe its dynamic characteristics: Average (mean) and temporal variability (standard deviation). These metrics are calculated as follows:

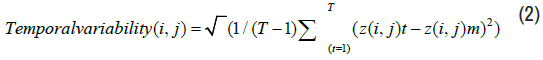
Where z(i, j)t is the functional connectivity value between ROI i and ROI j in the time window t, T is the number of windows, and z(i, j)m is the mean of z(i, j)t over the T windows.
Statistical analysis
For the fMRI statistical analyses, multiple comparison correction was performed using Gretna toolbox (http://www.nitrc.org/projects/gretna) with a threshold of uncorrected p<0.05. A 5000-times randomized permutation test was used. A permutation test is a kind of statistical significance test in which all potential values of the test statistic under rearrangements of the labels on the observed data points are calculated to obtain the distribution of the test statistic under the null hypothesis [37].The regions that made it through multiple comparison correction were chosen as Region of Interest (ROIs) for post hoc analysis. On these ROIs, a two-tailed, two-sample t-test was used to detect the differences between the groups (ADHD vs. TD). Statistical significance was defined as a p<0.025 (0.05/2) (Bonferroni corrected) value.
Results
Static resting state functional connectivity
There was no significant difference in average (p=0.395) and temporal variability (p=0.079) in static resting state functional connectivity between the ADHD and TD groups showing the traditional static functional connectivity’s insensitivity to capture neural functional abnormalities relating to ADHD.
Head motion
Based on the composite score of total motion for each individual, the results demonstrate that ADHD group also reported stronger correlation (r=0.62, p<0.001) between in-scanner head motion and ages compared to the TD group (r=-0.1, p<0.001) as seen in Figures 2A and 2B.

Figure 2A. Correlation graph showing in-scanner head motion and ages of ADHD group.

Figure 2B. Correlation graph showing in-scanner head motion and ages of TD group.
Dynamic resting state functional connectivity
Average limbic network functional connectivity: Average limbic network functional connectivity demonstrated a significant difference (p<0.05) between ADHD and TD groups in three consecutive temporal windows (w183, w184, w185) after controlling for age, gender and handedness (Table 2) (Figures 2 and 3).
| Temporal Windows | p value (uncorrected) | t value |
|---|---|---|
| 183 | 0.046 | 2.06 |
| 184 | 0.047 | 2.04 |
| 185 | 0.049 | 2.02 |

Figure 3. Functional connectivity map in a single subject level, A is for Attention- Deficit/Hyperactivity Disorder (ADHD) group, and B for Typically-Developing Controls (TD) group at w183 (7 min, 4 sec), w184 (7 min, 6 sec) and w185 (7 min, 8 sec) respectively. The lines partition the resting state functional connectivity maps into six subcategories (i.e., Prefrontal (PFR), Other Frontal (FR), Parietal (PR), Occipital (OR), Temporal (TR) and Subcortical regions (SUB).
ADHD group showed increased limbic network functional connectivity in these windows compared to the TD group with significant between-group limbic network resting state functional connectivity difference (Figure 4).

Figure 4. The average group functional connectivity maps at w183 (7 min, 4 sec), w184 (7 min, 6 sec) and w185 (7 min, 8 sec) respectively temporal windows. Where C is for Attention-Deficit/Hyperactivity Disorder (ADHD), D for Typically-Developing Controls (TD) and E is the group difference of the average dynamic resting state functional connectivity (ADHD-TD).
Variability of limbic network connectivity: As for temporal variability, we observed many obvious differences between the standard deviation maps of two groups (Table 3) (Figures 4-6). Especially in twenty five temporal windows (w132-w137, w140-w158) after controlling for age, gender and handedness.
| Temporal Windows | p value (uncorrected) | t value |
|---|---|---|
| 132 | 0.043 | 2.09 |
| 133 | 0.037 | 2.16 |
| 134 | 0.036 | 2.17 |
| 135 | 0.042 | 2.10 |
| 136 | 0.047 | 2.05 |
| 137 | 0.049 | 2.03 |
| 140 | 0.046 | 2.06 |
| 141 | 0.042 | 2.10 |
| 142 | 0.037 | 2.16 |
| 143 | 0.033 | 2.20 |
| 144 | 0.033 | 2.21 |
| 145 | 0.036 | 2.17 |
| 146 | 0.036 | 2.17 |
| 147 | 0.034 | 2.20 |
| 148 | 0.033 | 2.21 |
| 149 | 0.027 | 2.30 |
| 150 | 0.021 | 2.40 |
| 151 | 0.020 | 2.43 |
| 152 | 0.020 | 2.42 |
| 153 | 0.023 | 2.36 |
| 154 | 0.024 | 2.34 |
| 155 | 0.022 | 2.38 |
| 156 | 0.020 | 2.43 |
| 157 | 0.024 | 2.35 |
| 158 | 0.040 | 2.12 |

Figure 5 . The group variability maps at 25 different temporal windows for Attention- deficit/hyperactivity disorder (ADHD) group.

Figure 6. The group variability maps at twenty five different temporal windows for Typically-Developing Controls (TD).
ADHD group showed increased variability of limbic network connectivity in windows 132-137 (5 min 22 seconds to 32 seconds) and windows 140- 158 (5 min 38th second to 6 min 14 seconds) compared with TD group with significant between-group limbic network resting state functional connectivity difference (Figure 7).

Figure 7. The reproducibility maps of group variability differences (ADHD-TD) at twenty five temporal windows. Values are plotted as –log10 (p-value) x sign (t-statistic), achieved at P<0.05.
Discussion
Given the limbic network higher role in our emotions and motivations, we aimed to investigate whether functional connectivity of the limbic network was abnormal in ADHD-infected children. Interestingly, we found that significant differences existed in both average and temporal variability between ADHD and Typical-Developing Control (TD) children. To the best of our knowledge, this is the first study to address differences in functional connectivity in categorical and dimensional analyses based on Neoroimage Sample obtained from the ADHD-200 Sample dataset [25].
We utilized sliding window approach to construct dynamic resting state functional connectivity maps whose windowed limbic network connectivity properties were assessed. We also computed static resting state functional connectivity as correlation of fMRI time series over full-range of scanning time [33].
Our findings can be summarized as follows: (a) Static resting state functional connectivity did not reveal significant differences between ADHD and TD groups. (b) Compared with the TD group, dynamic connectivity analyses presented ADHD group with increased average functional connectivity in limbic region in three-time windows (w183, w184, and w185) (Table 2) (Figures 2 and 3). (c) In all temporal correlation windows, the variability of limbic network connectivity also demonstrated an increased functional connectivity in twenty five windows out of full range 222 windows (w(132-137) and w(140-158)) between the groups, findings that could not be identified in static functional connectivity analyses (Table 3) (Figures 5-7).
It has already been shown that dynamic functional connectivity has higher predictive power than static in ADHD and provides additional and more detailed information for characterization of functional malfunction, which makes it particularly important for classification of brain disorders [34,38-41]. Previous studies of ADHD associated with limbic network, Hulvershorn, et al. revealed higher emotional lability ratings associated with greater positive functional connectivity between the amygdala and rostral anterior cingulate cortex in youth with ADHD [42], the ADHD group exhibited more significant resting state functional connectivities with the dACC in bilateral dACC, bilateral thalamus, bilateral cerebellum, bilateral insula and bilateral brainstem compared to the controls in another study [14].
Nevertheless, some studies could not identify increased functional connectivity in this area, one study reported reduced resting-state brain activities in the bilateral putamen in the ADHD group, and no significant activity differences were found in the bilateral thalamus [43], another study due to severe depressive symptoms, reduced functional connectivity were also seen between the left hippocampus and the left Orbitofrontal Cortex (OFC) [44].
The occurrence of these differences perhaps results from the fact that different studies emphasized particularly ADHD patient’s subtype, so some findings may be more suitable for ADHD group of Hyperactivity/Impulsive or Inattentive subtype. While in the present study, most ADHD participants were of the combined subtype (72%). Moreover, another possible reason for the discrepant findings is the removal of motion and nuisance artifacts is of utmost importance in all functional connectivity fMRI studies, and in particular so in studies that include children with ADHD given that they are often more prone to move in the MR scanner compared to controls [40]. In line with this hypothesis, during the preprocessing exclusion criteria with 2.5 mm and 2.5 degree in max head motion, nine subjects were of ADHD (sub_02, 03, 04, 08, 09, 10, 20, 21, 22) and only one subject of TD (sub_03).
Our study however presented some limitations. In method we used sliding window for the dynamic rsFC analysis network construction, however, the authors of this work acknowledge that the sliding window technique has a number of drawbacks [45-47], such as multiple parameters must be specified, including window function, length, and step size, but due to a shortage of ground truth in resting state fMRI data, the ideal settings are still uncertain. We can confirm that our work just like the vast majority of resting state-dFC studies have employed this technique, mainly due to its simplicity [35].
It is also not clear whether the observed results are specific to only ADHD combined subtype or shared with all three types, this implies that our conclusions cannot be generalized to the broader ADHD population. Also absence of clinical measures related to ADHD limited us from evaluating the correlation between patterns of deficits observed in ADHD and its clinical evaluation. ADHD group demonstrated larger head motion compared to the TD group. Whether results were also influenced by the head motion should be the topic for future studies hence attention should be paid when interpreting the results.
Conclusion
This study demonstrated that children with Attention Deficit/ Hyperactivity Disorder indicated an increased average and variability of limbic network connectivity in short-time-scale (dynamic) based windows but did not present any significant results in full-time-scale (static) based analyses. These findings suggest that the demonstrated dynamic functional connectivity analyses provide strong insights to understand brain deficits underlying Attention Deficit/Hyperactivity Disorder than traditional full length fMRI analyses.
Acknowledgments
The authors thank all individuals who served as research participants.
Disclosures
The authors of this paper do not have any commercial associations that might pose a conflict of interest in connection with this manuscript.
Data Availability Statement
The data that support the findings of this study are openly available at the ADHD-200 sample website http://fcon_1000.projects.nitrc.org/indi/ adhd200/index.html.
Ethical Statement
Approval for the research and informed consent are not necessary for this type of work.
References
- Weiss, Gabrielle and Lily Trokenberg Hechtman. Hyperactive Children Grown Up: ADHD in Children, Adolescents, and Adults. New York: Guilford Press, USA, (1993).
- Faraone, Stephen V., Joseph Biederman and Eric Mick. "The Age-Dependent Decline of Attention Deficit Hyperactivity Disorder: A Meta-Analysis of Follow-Up Studies." Psychol Med 36 (2006): 159-65.
[Crossref] [Google scholar] [Pubmed]
- Biederman, Joseph. "Attention-Deficit/Hyperactivity Disorder: A Selective Overview." Biol Psychiatry 57 (2005): 1215-20.
[Crossref] [Google scholar] [Pubmed]
- National Institute of Mental Health. Attention-Deficit/Hyperactivity Disorder. Maryland: National Institute of Mental Health, USA, (2020).
- Wilens, Timothy E., Stephen V. Faraone and Joseph Biederman. "Attention-Deficit/Hyperactivity Disorder in Adults." Jama 292 (2004): 619-23.
[Crossref] [Google scholar] [Pubmed]
- Swanson, J. M., J. A. Sergeant, E. Taylor and Edmund JS Sonuga-Barke, et al. "Attention-Deficit Hyperactivity Disorder and Hyperkinetic Disorder." Lancet 351 (1998): 429-33.
[Crossref] [Google scholar] [Pubmed]
- Castellanos, F. Xavier. "Toward a Pathophysiology of Attention-Deficit/Hyperactivity Disorder." Clin Pediatr 36 (1997): 381-93.
[Crossref] [Google scholar] [Pubmed]
- Seidman, Larry J., Joseph Biederman, Wendy Weber and Mary Hatch, et al. "Neuropsychological Function in Adults with Attention-Deficit Hyperactivity Disorder." Biol Psychiatry 44 (1998): 260-8.
[Crossref] [Google scholar] [Pubmed]
- Ogawa, Seiji, David W. Tank, Ravi Menon and Jutta M. Ellermann, et al. "Intrinsic Signal Changes Accompanying Sensory Stimulation: Functional Brain Mapping with Magnetic Resonance Imaging." Proc Natl Acad Sci U S A 89 (1992): 5951-5.
[Crossref] [Google scholar] [Pubmed]
- Bush, George, Jean A. Frazier, Scott L. Rauch and Larry J. Seidman, et al. "Anterior Cingulate Cortex Dysfunction in Attention-Deficit/Hyperactivity Disorder Revealed by fMRI and the Counting Stroop." Biol Psychiatry 45 (1999): 1542-52.
[Crossref] [Google scholar] [Pubmed]
- Rubia, Katya, Stephan Overmeyer, Eric Taylor and Michael Brammer, et al. "Hypofrontality in Attention Deficit Hyperactivity Disorder During Higher-Order Motor Control: A Study with Functional MRI." Am J Psychiatry 156 (1999): 891-6.
[Crossref] [Google scholar] [Pubmed]
- Durston, Sarah, Nim T. Tottenham, Kathleen M. Thomas and Matthew C. Davidson, et al. "Differential Patterns of Striatal Activation in Young Children with and without ADHD." Biol Psychiatry 53 (2003): 871-8.
[Crossref] [Google scholar] [Pubmed]
- Schulz, Kurt P., Jin Fan, Cheuk Y. Tang and Jeffrey H. Newcorn, et al. "Response Inhibition in Adolescents Diagnosed with Attention Deficit Hyperactivity Disorder During Childhood: An Event-related FMRI Study." Am J Psychiatry 161 (2004): 1650-7.
[Crossref] [Google scholar] [Pubmed]
- Tian, Lixia, Tianzi Jiang, Yufeng Wang and Yufeng Zang, et al. "Altered Resting-State Functional Connectivity Patterns of Anterior Cingulate Cortex in Adolescents with Attention Deficit Hyperactivity Disorder." Neurosci Lett 400 (2006): 39-43.
[Crossref] [Google scholar] [Pubmed]
- Cao, Qingjiu, Yufeng Zang, Li Sun and Manqiu Sui, et al. "Abnormal Neural Activity in Children with Attention Deficit Hyperactivity Disorder: A Resting-state Functional Magnetic Resonance Imaging Study." Neuroreport 17 (2006): 1033-6.
[Crossref] [Google scholar] [Pubmed]
- Tian, Lixia, Tianzi Jiang, Meng Liang and Yufeng Zang, et al. "Enhanced Resting-State Brain Activities in ADHD Patients: A fMRI Study." Brain Dev 30 (2008): 342-8.
[Crossref] [Google scholar] [Pubmed]
- Biswal, Bharat, F. Zerrin Yetkin, Victor M. Haughton and James S. Hyde. "Functional Connectivity in the Motor Cortex of Resting Human Brain using Echo-Planar MRI." Magn Reson Med 34 (1995): 537-41.
[Crossref] [Google scholar] [Pubmed]
- Consortium, ADHD-200. "The ADHD-200 Consortium: A Model to Advance the Translational Potential of Neuroimaging in Clinical Neuroscience." Front Syst Neurosci 6 (2012): 62.
[Crossref] [Google scholar] [Pubmed]
- Elton, Amanda, Sarael Alcauter and Wei Gao. "Network Connectivity Abnormality Profile Supports a Categorical-Dimensional Hybrid Model of ADHD." Hum Brain Mapp 35 (2014): 4531-43.
[Crossref] [Google scholar] [Pubmed]
- Wang, Xun-Heng, Yun Jiao, and Lihua Li. "Predicting Clinical Symptoms of Attention Deficit Hyperactivity Disorder Based on Temporal Patterns between and within Intrinsic Connectivity Networks." Neuroscience 362 (2017): 60-69.
[Crossref] [Google scholar] [Pubmed]
- Nomi, Jason S., Elana Schettini, Willa Voorhies amd Taylor S. Bolt, et al. "Resting-State Brain Signal Variability in Prefrontal Cortex is Associated with ADHD Symptom Severity in Children." Front Hum Neurosci 12 (2018): 90.
[Crossref] [Google scholar] [Pubmed]
- Sörös, Peter, Eliza Hoxhaj, Patricia Borel and Chiharu Sadohara, et al. "Hyperactivity/Restlessness is associated with Increased Functional Connectivity in Adults with ADHD: A Dimensional Analysis of Resting State fMRI." BMC Psychiatry 19 (2019): 1-11.
[Crossref] [Google scholar] [Pubmed]
- Bailey, Regina. "The Limbic System of the Brain." Thought Co, March 28, (2018).
- Silver, Larry “The ADHD Brain: Neuroscience Behind Attention Deficit.” Additude, September 18, (2020).
- Milham, Michael P. “ADHD200.” Indi, September 18, (2020).
- Friston, Karl J., Steven Williams, Robert Howard and Richard SJ Frackowiak, et al. "Movement-Related Effects in fMRI Time-Series." Magn Reson Med 35 (1996): 346-55.
[Crossref] [Google scholar] [Pubmed]
- Ashburner, John. "A Fast Diffeomorphic Image Registration Algorithm." Neuroimage 38 (2007): 95-113.
[Crossref] [Google scholar] [Pubmed]
- He, Changchun, Yanchi Chen, Taorong Jian and Heng Chen, et al. "Dynamic Functional Connectivity Analysis Reveals Decreased Variability of the Default-Mode Network in Developing Autistic Brain." Autism Res 11 (2018): 1479-93.
[Crossref] [Google scholar] [Pubmed]
- Xin, Qilong, Laura Ortiz-Terán, Ibai Diez and David L. Perez, et al. "Sequence Alterations of Cortical Genes Linked to Individual Connectivity of the Human Brain." Cereb Cortex 29 (2019): 3828-35.
[Crossref] [Google scholar] [Pubmed]
- Tzourio-Mazoyer, Nathalie, Brigitte Landeau, Dimitri Papathanassiou and Fabrice Crivello, et al. "Automated Anatomical Labeling of Activations in SPM using a Macroscopic Anatomical Parcellation of the MNI MRI Single-Subject Brain." Neuroimage 15 (2002): 273-89.
[Crossref] [Google scholar] [Pubmed]
- Wang, Kun, Meng Liang, Liang Wang and Lixia Tian, et al. "Altered Functional Connectivity in Early Alzheimer's Disease: A Resting-State fMRI Study." Hum Brain Mapp 28 (2007): 967-78.
[Crossref] [Google scholar] [Pubmed]
- Xia, Mingrui, Jinhui Wang and Yong He. "BrainNet Viewer: A Network Visualization Tool for Human Brain Connectomics." PLoS One 8 (2013): e68910.
[Crossref] [Google scholar] [Pubmed]
- Allen, Elena A., Eswar Damaraju, Sergey M. Plis and Erik B. Erhardt, et al. "Tracking Whole-Brain Connectivity Dynamics in the Resting State." Cereb Cortex 24 (2014): 663-76.
[Crossref] [Google scholar] [Pubmed]
- Damaraju, Eswar, Elena A. Allen, Aysenil Belger and Judith M. Ford, et al. "Dynamic Functional Connectivity Analysis Reveals Transient States of Dysconnectivity in Schizophrenia." Neuroimage 5 (2014): 298-308.
[Crossref] [Google scholar] [Pubmed]
- Preti, Maria Giulia, Thomas AW Bolton and Dimitri Van De Ville. "The Dynamic Functional Connectome: State-of-the-art and Perspectives." Neuroimage 160 (2017): 41-54.
[Crossref] [Google scholar] [Pubmed]
- Shakil, Sadia, Chin-Hui Lee and Shella Dawn Keilholz. "Evaluation of Sliding Window Correlation Performance for Characterizing Dynamic Functional Connectivity and Brain States." Neuroimage 133 (2016): 111-28.
[Crossref] [Google scholar] [Pubmed]
- Nichols, Thomas E. and Andrew P. Holmes. "Nonparametric Permutation Tests for Functional Neuroimaging: A Primer with Examples." Hum Brain Mapp 15 (2002): 1-25.
[Crossref] [Google scholar] [Pubmed]
- Nyatega, Charles Okanda, Li Qiang, Mohammed Jajere Adamu and Ayesha Younis, et al. "Altered Dynamic Functional Connectivity of Cuneus in Schizophrenia Patients: A Resting-State fMRI Study." Applied Sci 11 (2021): 11392.
- Calhoun, Vince D., Robyn Miller, Godfrey Pearlson and Tulay Adali. "The Chronnectome: Time-varying Connectivity Networks as the Next Frontier in fMRI Data Discovery." Neuron 84 (2014): 262-74.
[Crossref] [Google scholar] [Pubmed]
- Kaboodvand, Neda, Behzad Iravani and Peter Fransson. "Dynamic Synergetic Configurations of Resting-State Networks in ADHD." Neuroimage 207 (2020): 116347.
[Crossref] [Google scholar] [Pubmed]
- Zhang, Jie, Wei Cheng, Zhaowen Liu and Kai Zhang, et al. "Neural, Electrophysiological and Anatomical Basis of Brain-Network Variability and its Characteristic Changes in Mental Disorders." Brain 139 (2016): 2307-21.
- Hulvershorn, Leslie A., Maarten Mennes, F. Xavier Castellanos and Adriana Di Martino, et al. "Abnormal Amygdala Functional Connectivity Associated with Emotional Lability in Children with Attention-Deficit/Hyperactivity Disorder." J Am Acad Child Adolesc Psychiatry 53 (2014): 351-61.
[Crossref] [Google scholar] [Pubmed]
- Teicher, Martin H., Carl M. Anderson, Ann Polcari and Carol A. Glod, et al. "Functional Deficits in Basal Ganglia of Children with Attention-Deficit/Hyperactivity Disorder Shown with Functional Magnetic Resonance Imaging Relaxometry." Nat Med 6 (2000): 470-3.
[Crossref] [Google scholar] [Pubmed]
- Posner, Jonathan, Francesco Siciliano, Zhishun Wang and Jun Liu, et al. "A Multimodal MRI Study of the Hippocampus in Medication-Naive Children with ADHD: What Connects ADHD and Depression?" Psychiatry Res 224 (2014): 112-8.
[Crossref] [Google scholar] [Pubmed]
- Hindriks, Rikkert, Mohit H. Adhikari, Yusuke Murayama and Marco Ganzetti, et al. "Can Sliding-Window Correlations Reveal Dynamic Functional Connectivity in Resting-State fMRI?" Neuroimage 127 (2016): 242-56.
[Crossref] [Google scholar] [Pubmed]
- Hutchison, R. Matthew, Thilo Womelsdorf, Elena A. Allen and Peter A. Bandettini, et al. "Dynamic Functional Connectivity: Promise, Issues, and Interpretations." Neuroimage 80 (2013): 360-78.
[Crossref] [Google scholar] [Pubmed]
- Leonardi, Nora and Dimitri Van De Ville. "On Spurious and Real Fluctuations of Dynamic Functional Connectivity During Rest." Neuroimage 104 (2015): 430-6.
[Crossref] [Google scholar] [Pubmed]
Citation: Nyatega, Charles O., Li Qiang, Mohammed A. Jajere and Halima Bello Kawuwa. “Atypical Functional Connectivity of Limbic Network in Attention Deficit/Hyperactivity Disorder.” Clin Schizophr Relat Psychoses 16 (2022). Doi: 10.3371/CSRP.NCLQ.053122.
Copyright: © 2022 Nyatega CO, et al. This is an open-access article distributed under the terms of the Creative Commons Attribution License, which permits unrestricted use, distribution, and reproduction in any medium, provided the original author and source are credited. This is an open access article distributed under the terms of the Creative Commons Attribution License, which permits unrestricted use, distribution, and reproduction in any medium, provided the original work is properly cited.